


Our Thinking Fri 2nd October, 2015
Why is the work taking so long? How an Equal Experts team improved their completion time (part 2)
This is the second post in our series about how we responded to the question: ‘why is it taking so long?’.
In the first post, I explained the problems we discovered and the six week experiment we ran to address them. In this final post, we cover the results and our learnings since then.
What we did
We split the delivery team into three with two of the teams focusing on one initiative each. The remaining, smaller team focused on live service support. We wanted to avoid protracted Cycle Times and to control the flow of work. To do this, each team looked at keeping their total Work In Progress in check.
We captured data about our performance to help us understand more about our process and if we were improving. This data helped us explain what was happening week on week and allowed comparisons against our benchmark data to quantify the improvements made. We reviewed the data with our client each Friday. We discussed key blockers and expectations of whether we could meet their desired outcome. This helped the client understand what we were and weren’t doing. We also wanted the data to speak for itself. It wasn’t enough for us to say, “It’s not taking as long”, we wanted the client to see this. To help them, we presented and discussed these metrics:
- Throughput or the number of work items completed per week. We tracked this as a weekly trend to help make high-level predictions on our expected completion date.1
- Cycle Time or the elapsed time taken from starting a work item to finishing. As shown in part one, we used this to assess whether we were taking more or less time to complete work. It also helped to identify overrunning work items and any significant gaps in delivery time.
- Work In Progress or the total number of work items started by a team. This, shown as a daily trend and as a cumulative flow diagram (CFD), helped us assess if we were taking on more or less work. We used the CFD to help identify bottlenecks in our process.
- Blockers or those things that prevent us from completing work. We looked at the number of blocked work items and the total amount of time blocked. By quantifying the amount of time lost and the impact, we were able to escalate and resolve issues quicker than before.
Our goal was to see a reduction in our total Work In Progress and, as a result, our Cycle Time too. We also wanted the team and business to provide positive feedback on the new approach.
What happened
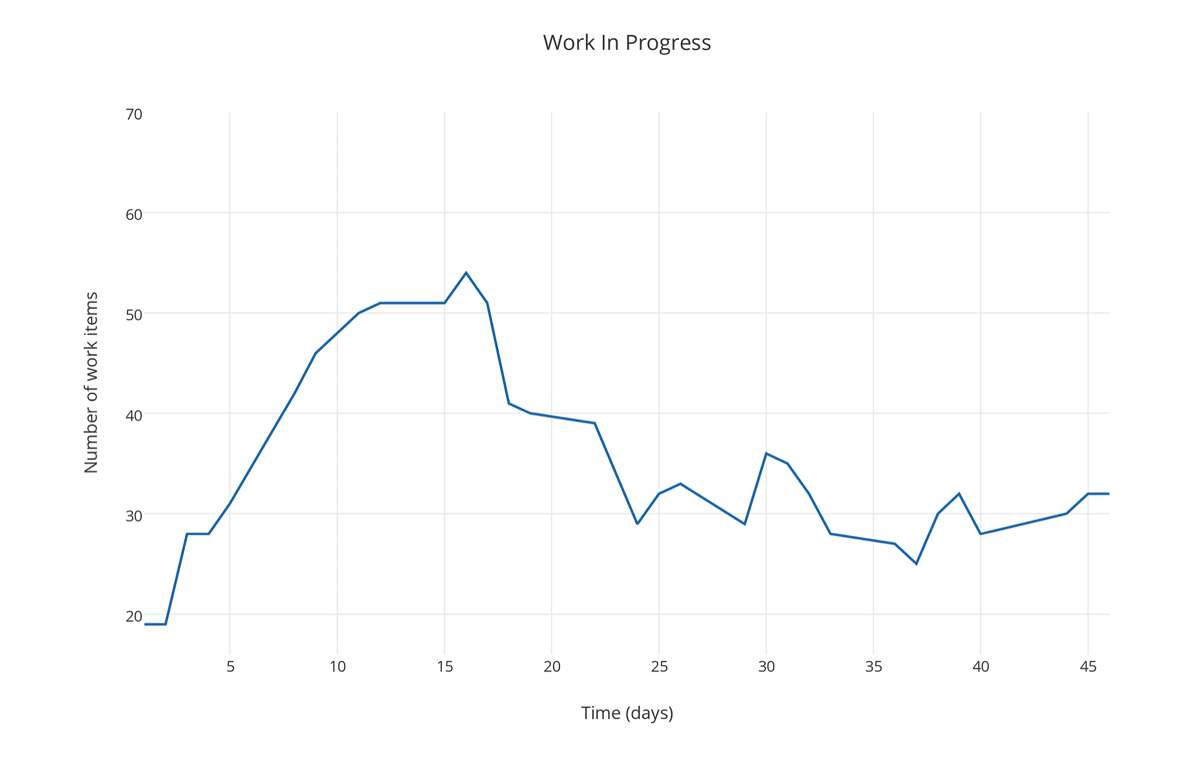
In the first two weeks, we hit a major blocker. We could not deploy updates to the service due to environment issues. This resulted in an increasing amount work waiting for test. We had to decide whether to stop work (not ideal) or continue whilst hoping that we could fix the blocker. We decided on the latter. This meant our Work In Progress increased just as we were trying to avoid doing so. The chart below shows this increase followed by the drop after we fixed the problem. The x-axis shows time in days and the y-axis shows the number of unfinished work items.
After overcoming this problem, we started to see real improvements. Each team could now to focus on a single, well-defined outcome instead of switching between initiatives. This approach helped the business with priority decisions. We asked them to choose what we should deliver via two ‘slots’ they could fill. Making new requests had two possible outcomes. Either we would wait for one slot to free up or we would delay an existing commitment.
Reducing our Work In Progress helped us reduce our Cycle Time. The chart below shows Cycle Times for work completed during the six week experiment. The x-axis shows the completion day and the y-axis shows Cycle Time measured in days (plotted against the day the team completed each work item). I’ve kept the scale the same as the chart shown in part one.
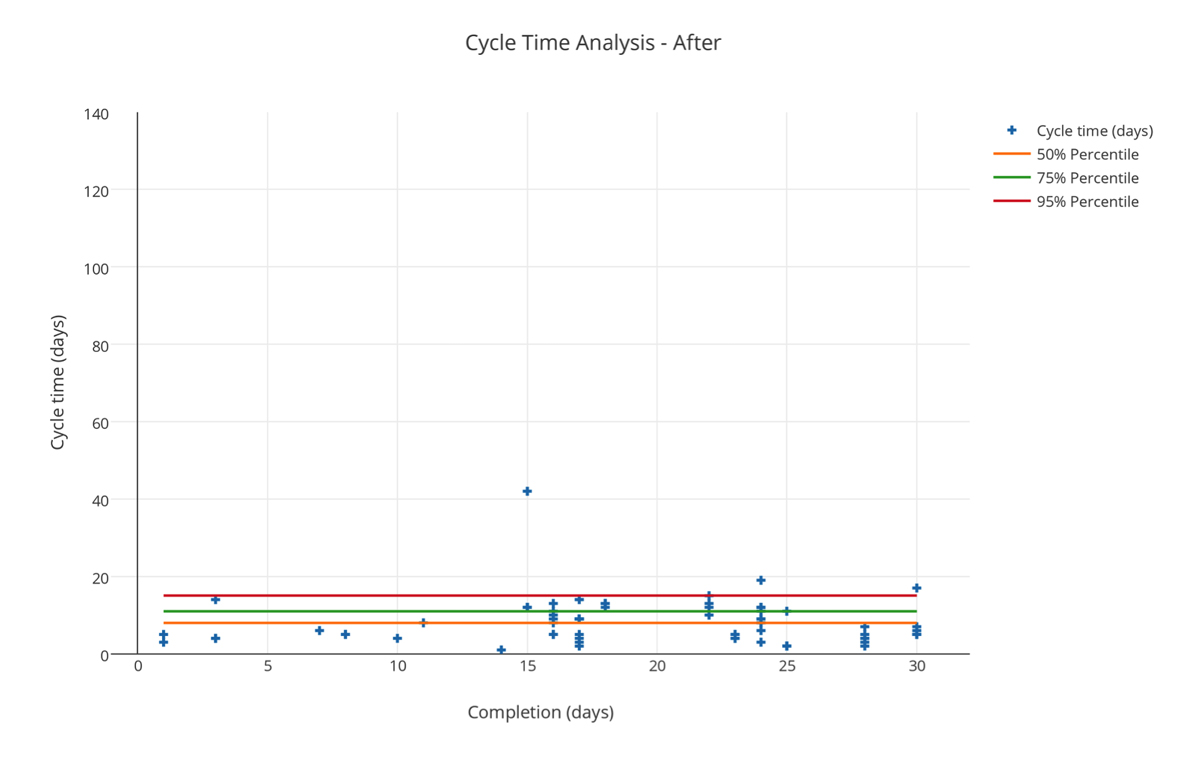
This chart shows the stark difference in the time taken to finish work. You can see the significant decrease in the time taken to finish work compared to the benchmark. 95% of work was now completed in 15 days or less compared to 81 days. The orange, green and red lines show standard 50%, 75%, and 95% percentiles for these Cycle Times and help show the reduction in variability.
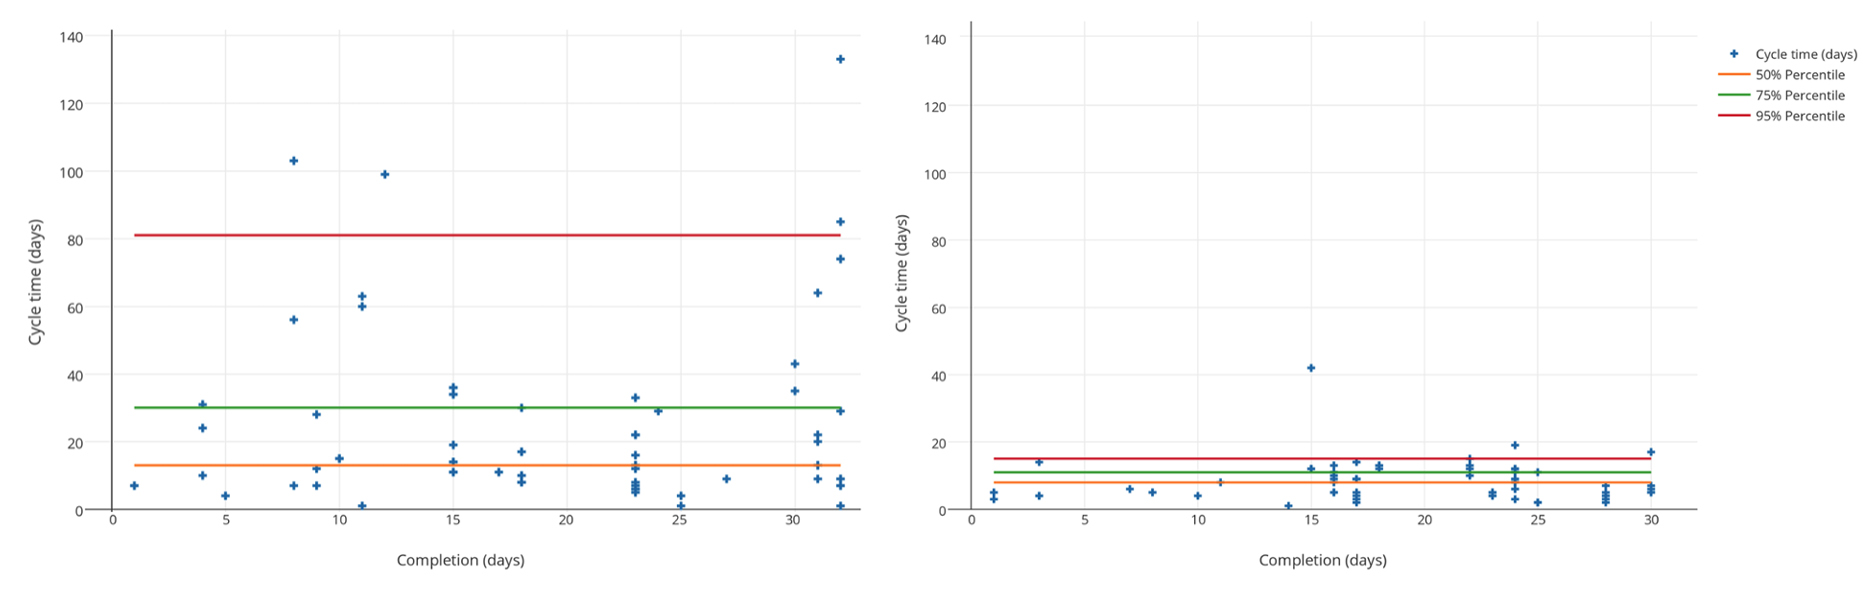
Cycle Times before (left) and after (right) the six week experiment
Showing an improvement in metrics is one thing, but what about actually delivering value? The good news was that we completed the first planned update to the service within five weeks instead of six. Feedback from the team and the business stakeholders was positive. They appreciated our ability to adapt and respond to last minute changes. This proved difficult given the team’s other commitments earlier in the year. Our collaboration was more effective and everyone preferred the focus on doing less to do more.
What we’ve learned
Metrics, such as story points and velocity, are subjective and open to misinterpretation. It’s easy to fall into the trap of fixating on how many story points the team delivered instead of actual value. The metrics described in this series of posts are straightforward to collect2. They help support an explanation of progress by using real world measurements (e.g. features delivered per week). By using them, teams can:
- Gauge whether they are becoming more or less predictable.
- Highlight total days lost due to blockers (an excellent way of ensuring swift resolution).
- Make decisions to help identify problems before they occur.
We accepted our client’s challenge of reducing development time in just six weeks. They understood the improvements we demonstrated and agreed that we had made good progress. Our next challenge was to take a step back and look for improvements in the total time taken from idea through to release.
Teams should look at how they continuously improve. It is important that they do so whilst keeping end goals in mind. In the majority of cases, building the right thing slower is more beneficial for an organisation than building the wrong thing faster.
1 Past performance is no guarantee for the future, but you can use this to help guide decision-making. A simple example: let’s assume a team has 100 work items remaining and a Throughput trend of about 10 work items per week. The delivery date is in 5 weeks. We can say, with some certainty, that this finish date is unlikely without intervention.
2 For further information, Dan Vacanti’s book Actionable Agile Metrics is a superb read.