


Our Thinking Thu 3rd September, 2015
Why is it taking so long? How an Equal Experts team improved their completion time (part 1)
What’s the best way of answering the question, “why is it taking so long?”
In this series of posts we’ll explain how one of our teams responded to this often emotive question, what they did to help our client understand the underlying reasons of why things take time, the results, and what we have learned since then. In this first post, I will explain the problems we encountered and what we decided to do.
Earlier this year, one of our clients told us they were concerned with the overall time taken to make updates to their service. Work had begun to mount up and we wanted to know why. We agreed to assess how we were working together to identify any problems that could be causing delays. Based on these findings, we ran a six week experiment designed to address their concerns.
Using data from the client’s issue tracking tool to gather metrics and looking at the delivery approach in detail, we noticed some clear indicators on what might be wrong:
- It was difficult to keep track of Work In Progress (the number of incomplete work items we had committed to)
- Incoming requests to start new work did not account for existing commitments
- Not all work was visible
- There was significant variability in Cycle Times (in this instance, the elapsed time between work starting and sign off by a product owner)
This resulted in the team putting significant work on hold and focusing on newer work items instead of finishing those closer to completion. Taking on additional work whilst trying to meet existing commitments became a frustration for everyone. Our Work In Progress and Cycle Times increased and the data we gathered confirmed this.
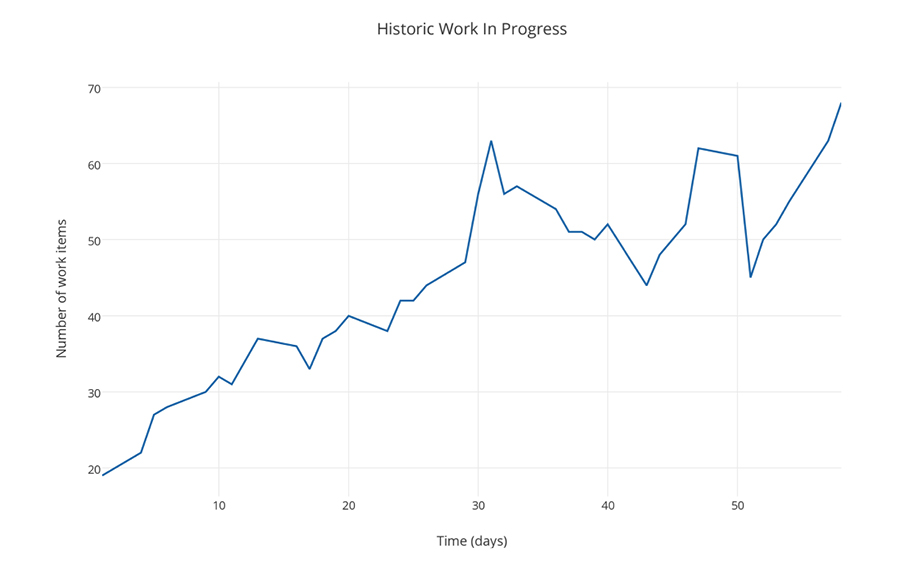
The chart below shows the upward trend of Work In Progress over a period of two months before we started the experiment. The x-axis shows time in days and the y-axis shows the number of unfinished work items. In this case, there was a steady increase in the number of items that were unfinished.
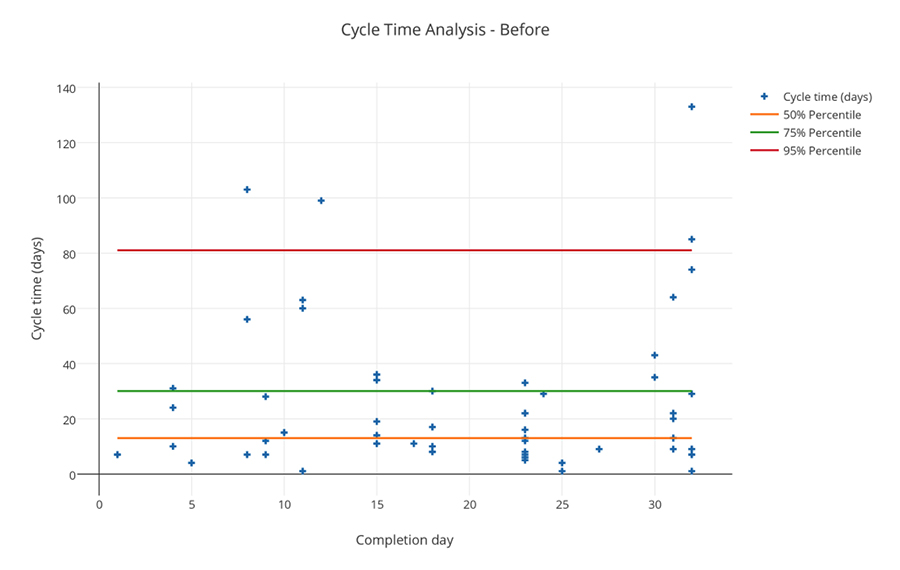
The chart below shows the Cycle Times for all work items completed one month before the experiment. The x-axis shows the completion day and the y-axis shows Cycle Time measured in days (plotted against the day the team completed each work item). The orange, green and red lines show standard 50%, 75%, and 95% percentiles for these Cycle Times and help show variability: 50% of work items took 13 days or less to finish whereas 95% of work items took 81 days or less.
Based on these findings, we decided that three significant – but low hassle – changes could help counter and then reverse these upward trends. They were:
- Split the team into three smaller teams with each defining how much Work In Progress they were willing to take on
- Reduce the number of simultaneous business requests from eight to two (with the third team looking after live service support and improvements)
- Capture more data about our work and process to help understand if we were making improvements
Read the second post of this 2-part series to learn the results of this experiment – and what we’ve learned from them.