Why unplanned tech work is a silent killer
I speak with customers across the Equal Experts network, to understand their scaling problems. I’m sometimes asked ‘why don’t my teams have enough capacity to deliver’, or ‘what’s the business benefit of standardization’, and unplanned tech work is usually involved in both. It has a proven link to poor technical quality, and if you don’t control it, it’ll silently kill team capacity.
I once visited a British telco where 20 autonomous teams were building digital services on GCP. A delivery manager said “our teams do You Build It You Run It, they frequently deploy, but features are slow to reach customers and we don’t know why”. When I suggested measuring team capacity as value-adding and non-value-adding work, the manager predicted an 80/20 split. They were horrified when an analysis revealed a 20/80 split, with teams averaging 60% of their time on unplanned tech work!

What is unplanned tech work, why was it silently killing team capacity at this telco, and how did they start to turn the situation around?
The impact of unplanned tech work
Team capacity can be divided into product work and tech work. Product work is about delivering value-add, to satisfy business demand and user needs. Planned tech work is proactive tech initiatives, and routine BAU maintenance. Unplanned tech work is also known as break/fix or rework, and consists of reactive fixes, patching, and emergency maintenance. It includes configuration errors, defects, deployment failures, environment issues, security vulnerabilities, and test failures.

Unplanned tech work harms technical quality and delivery speed. More unplanned tech work means more quality problems and slower feature delivery. This was proven by Dr. Nicole Forsgren et al in Accelerate, which showed high-performing organizations spend 29% less time on unplanned tech work. It also found that continuous delivery practices like frequent deployments are a predictor of low unplanned tech work.
At the British telco, their high levels of unplanned tech work were due to a lack of technology alignment. Without guidelines from senior leadership, the 20 teams had created 20 unique stacks in Go, Java, and Python hosted on App Engine, Cloud Run, and Kubernetes. There was no standardization at all, and the majority of deployments were solely configuration and infrastructure fixes. Teams were running just to stand still, but why hadn’t this been noticed before?
Why unplanned tech work is a silent killer
Unplanned tech work silently consumes team capacity because it’s:
- Unmeasured. Teams tend to measure quality as outputs, like code coverage or defect count. They don’t look at outcomes, like the rate of break/fix work and its impact on delivery speed
- Unautomatable. There are many sources of break/fix work, and it’s hard to create automated measurements of toil because break/fix work occurs inside everyday tasks
- Unquestioned. Break/fix work becomes accepted as the norm over time. Teams overlook recurring problems, leading to the normalization of deviance where the abnormal becomes the normal
Unplanned tech work can be measured as rework rate percentage, which comes from Accelerate. Trying to automate it by analyzing Jira tickets and/or Git commits is time-consuming, and misses a lot of break/fix work. It’s more cost effective to ask engineers to estimate what percentage of their time is spent on unplanned tech work. That estimate should be understood as a high level percentage, not a detailed breakdown. Micro-management is counterproductive, and there’s too much variability for accurate forecasting.
At the British telco, a weekly Google Form survey was introduced to ask engineers a single question ‘what % of your time last week was spent on reactive fixes and emergency maintenance’, with a picklist for worst offenders. The survey highlighted teams with the most rework, identified Kubernetes as a regular break/fix source, and produced actionable insights such as one tech lead reporting “30% of my time every week is spent reconfiguring Kubernetes, it’s not our core competency”.
How to control unplanned tech work
You can’t eliminate unplanned tech work, but it can be controlled:
- Identify major sources of unplanned tech work. Use team feedback to observe trends in unplanned tech work, and prioritize the jobs to be done
- Create technical alignment. Ask your senior leaders to set contextual technology guidelines. This might include standardization on tech stacks, ways of working, or measures of success
- Implement technical alignment as paved roads. Empower a platform engineering team to create friction-free, self-service capabilities that are fast and fault-free with zero maintenance for teams
- Prioritize technical quality alongside functionality. Encourage teams to treat quality as the foundation of a great user experience, and build quality into digital services from the outset
As always, we recommend a test-and-learn approach focused on outcomes. Don’t spend months building an unwanted platform. Don’t standardize everything for the sake of it. Run short experiments to eliminate the largest source of break/fix work. When teams report improvements, move onto the next largest source, and continue until teams achieve a consistently low level of unplanned tech work.
At the British telco, the major break/fix sources were Kubernetes underprovisioning and GCP misconfiguration. A platform engineering team was formed to create migration routes from App Engine and Kubernetes onto Cloud Run, and a self-service Cloud Run deployment pipeline. There was a substantial drop in break/fix work, and the artificially high deployment speed slowed down. This resulted in more capacity for teams to focus on value delivery.
Conclusion
When teams don’t have enough delivery capacity, it’s possible they’re suffering from too much unplanned tech work. This means reactive fixes and emergency maintenance work, and it’s usually unmeasured. Asking teams to regularly estimate the percentage of their time spent on unplanned tech work can quickly yield valuable insights.
Don’t build an unwanted platform, and don’t standardize for the sake of it. Focus on the desired outcome, unlock opportunities to eliminate sources of break/fix work, and standardize where appropriate to make incremental improvements. This will drive up technical quality, and allow teams to work towards engineering excellence.
I speak with customers and consultants across the Equal Experts network, to help our customers solve scaling problems and achieve business agility. One topic that often comes up is delivery assurance, and it’s easy to get it wrong. Our preference is to automate and visualise the DORA metrics in a services portal, and use trends to identify assurance needs.
Delivery assurance is about identifying risks, generating insights, and implementing corrective actions, so your delivery teams can deliver business outcomes on time and to a high standard. And it’s challenging when teams are remote-first, in different offices, and/or in different timezones.
The easiest way to get delivery assurance wrong is to measure the wrong thing. Code coverage, story points, and velocity are good examples. They’re easy to implement (which might explain their popularity), but they’re team outputs rather than value stream outcomes. They’re unrelated to user value, offer limited data, and can be gamed by teams incentivised to over-report progress. People change how they behave based on how they’re measured.
At Equal Experts, our delivery assurance advice is the same whether you’ve got 1, 10, or 100 teams:
- Automate the DORA metrics
- Visualise the data in a services portal
- Use trends to identify assurance needs
I once worked in a UK government department with 60 teams in 4 offices. In a meeting, I asked senior managers to write down which teams they were concerned about, and then showed them a new services portal with the DORA metrics. The data highlighted two teams quietly trending downwards, which nobody had written down. Corrective actions were adopted by the teams, and the customer was delighted with our delivery assurance. This is covered in-depth in a public conference talk, which you can see here.
Automate the DORA metrics
The Accelerate book by Dr. Nicole Forsgren et al is a scientific study of IT delivery. It includes the DORA metrics – deployment frequency, deployment lead time, deployment fail rate, time to restore, and rework rate. They’re a great fit for delivery assurance because they’re value stream outcomes, statistically significant performance predictors, and interdependent for success. For example, you can’t rapidly deliver features without a short lead time, and that needs a high standard of technical quality, and that’s implied by a low rework rate.
We recommend the DORA metrics to our customers. We usually expand rework rate into unplanned work rate, so it can include ad hoc value demand as well as failure demand. That gives us an idea of team capacity as well as technical quality. In our experience, it’s better to measure unplanned work than planned work, because the latter is often over-reported. Again, people change how they behave based on how they’re measured!
We automate these metrics for live services with monthly measurements. There are plenty of implementation routes. A live runtime could be EKS or Cloud Run, a system of record could be ServiceNow or Fresh Service, and a ticketing system could be Jira or Trello.
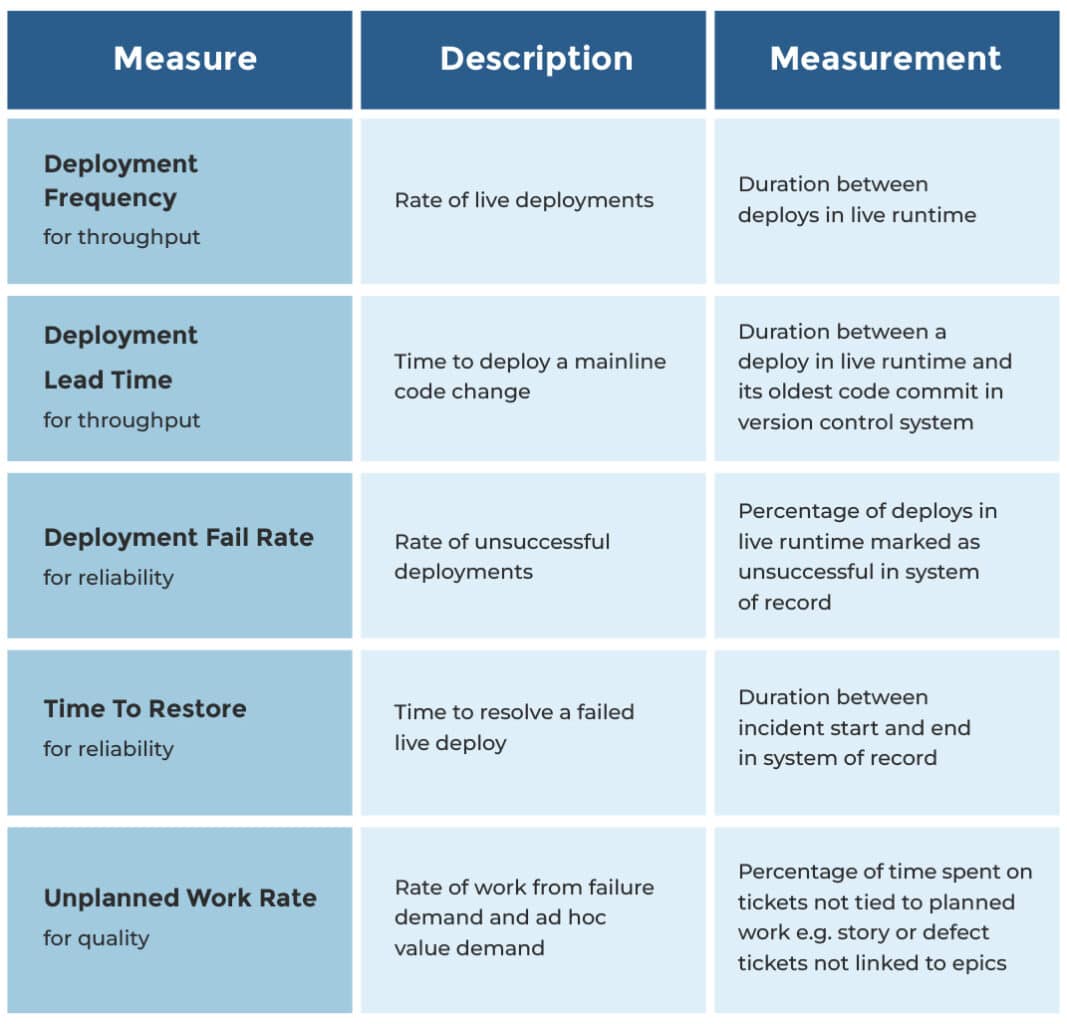
If you don’t have any live services yet, we’d advise frequent deployments of your in-development services into a production environment sealed off from live traffic, and still using these same metrics. And if you aren’t able to do that, it’s still worth measuring unplanned work rate, as it tells you how much time your teams are actually building planned features, versus fixing defects and reworking features without user feedback. That’s always good to know.
Visualise the data in a services portal
A services portal is a dynamic knowledge base for your organisation. It’s a central directory of teams, services, telemetry, change requests, deployments, incidents, and/or post-incident reviews. It replaces all those documents, spreadsheets, and wiki pages that quickly fall out of date.
You might know this as a developer portal from Spotify Backstage, a popular open-source framework for building portals. We’re fans of Backstage, and prefer to talk about services portals to emphasise knowledge bases are for everybody, not just engineers.
Delivery assurance can be implemented in your services portal. It can suck out all the necessary data from your version control system, system of record, ticketing system, and live runtime. Each service page can include DORA metrics, so you can see if a service is trending in the right direction. Those metrics can also be aggregated on each team page. Here’s what those DORA metrics might look like.
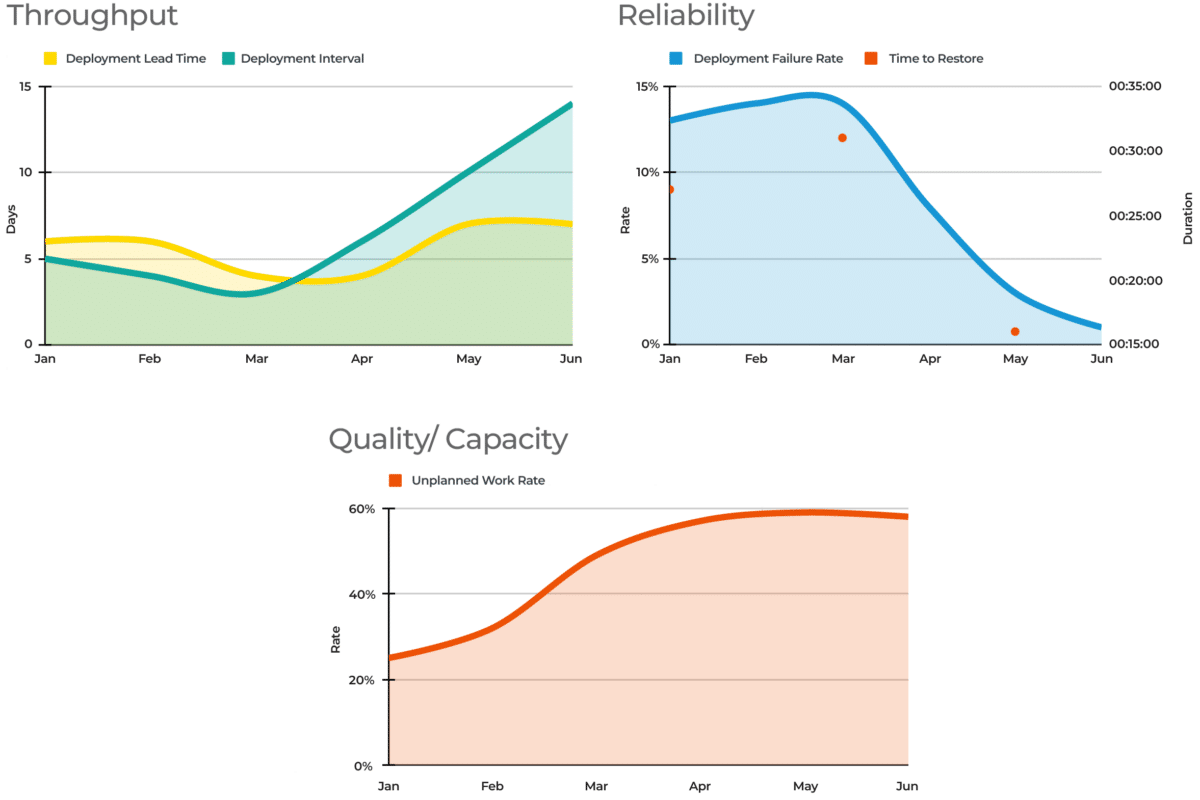
Yet again, people change how they behave based on how they’re measured! Always put the DORA metrics for one service or team on one page. Don’t put metrics for two services or two teams on one page. You’re encouraging teams to continuously improve based on their own efforts, not compete against other teams with different contexts and constraints.
Use trends to identify assurance needs
Visualising the DORA metrics in a services portal brings delivery assurance to life. Different team and service pages will show which teams are continuously improving, and which teams are unwittingly sliding in the wrong direction. You’ll understand where investing additional time and effort can put teams back on the right track.
Metrics tell you where to find the most valuable stories, not what the stories are. The above graphs show a delivery team where throughput and unplanned work are worsening, and failure rate is improving. But the metrics don’t explain why this is, and there’s plenty of potential reasons – a slowdown in planned features, an increase in test environments, or a new hard dependency. It’s important to listen to teams with assurance needs, and understand their situation in detail.
A Developer Experience (DevEx) team is a logical choice to own a services portal and its DORA metrics. They can also consult with teams to understand their assurance needs, and offer assistance where required. It’s a supportive, broad role that is best suited to expert practitioners who’ve previously worked on delivery teams in the same organisation.
Conclusion
Delivery assurance is important, and it’s easy to get it wrong by measuring team outputs. The DORA metrics by Dr. Nicole Forsgren et al are statistically significant predictors of IT performance, and it’s relatively straightforward to automate their measurements and visualise them in a services portal. It’s then possible to see at a glance which teams are headed in the wrong direction, and offer them assistance from expert practitioners in a Developer Experience (DevEx) team.
I speak with customers and consultants across the Equal Experts network, to help our customers solve scaling problems and achieve business agility. One of our customers recently asked me ‘how do we do maintenance mode in a DevSecOps world’ and our answer of ‘create multi-product teams’ deserves an explanation.
Maintenance mode is when demand for change declines to zero for live digital services and data pipelines, and the rate of maintenance tasks supersedes planned value-adding work. Working on maintenance tasks alone (capacity fixes, library upgrades, security fixes) is also known as ‘keeping the lights on’, or ‘BAU support’.
Zero demand doesn’t mean zero user needs, zero planned features, or zero faults. Software can’t entirely satisfy users, can’t be finished, and can’t be fault-free. Zero demand really means zero funding for more planned features.
Zero demand services are put into maintenance mode so teams can be reassigned to increase capacity for new propositions, or resized/retired to reduce costs. But those outcomes aren’t enough. You also need to protect live services reliability, staff job satisfaction, and future feature delivery. No funding today doesn’t mean giving up on a better tomorrow.
Implementing an effective ownership model for zero demand services is difficult. At Equal Experts we call it the Maintenance Mode Problem. You can spot it by listening out for people saying ‘we need to increase capacity’ or ‘we need to reduce costs’. Or you can measure unplanned work rate across your teams, and look for a decline in planned features.
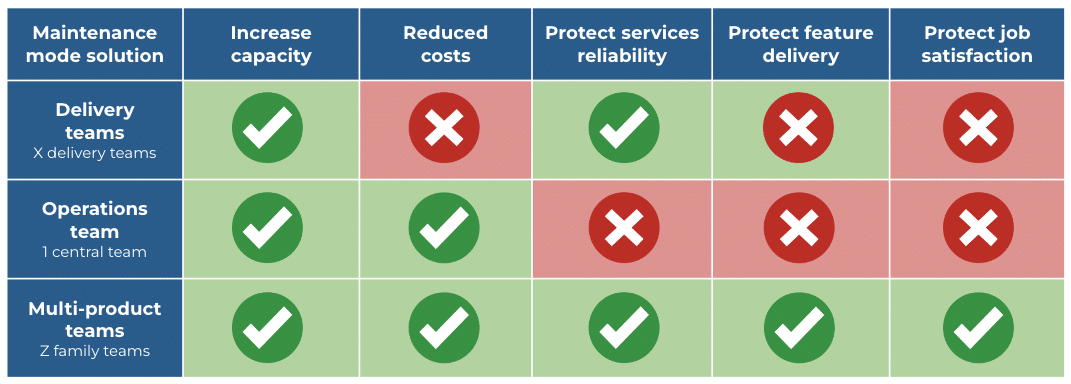
Here’s a comparison of maintenance mode solutions, and their impacts on those outcomes.
Solution #1 – delivery teams
Delivery teams maintain zero demand services in the background, and build new services in the foreground, while an operations team does live support for everyone. Here’s an example from a composite American retailer. 11 of 13 teams are building non-differentiators, and they maintain their live services themselves when zero demand is reached.
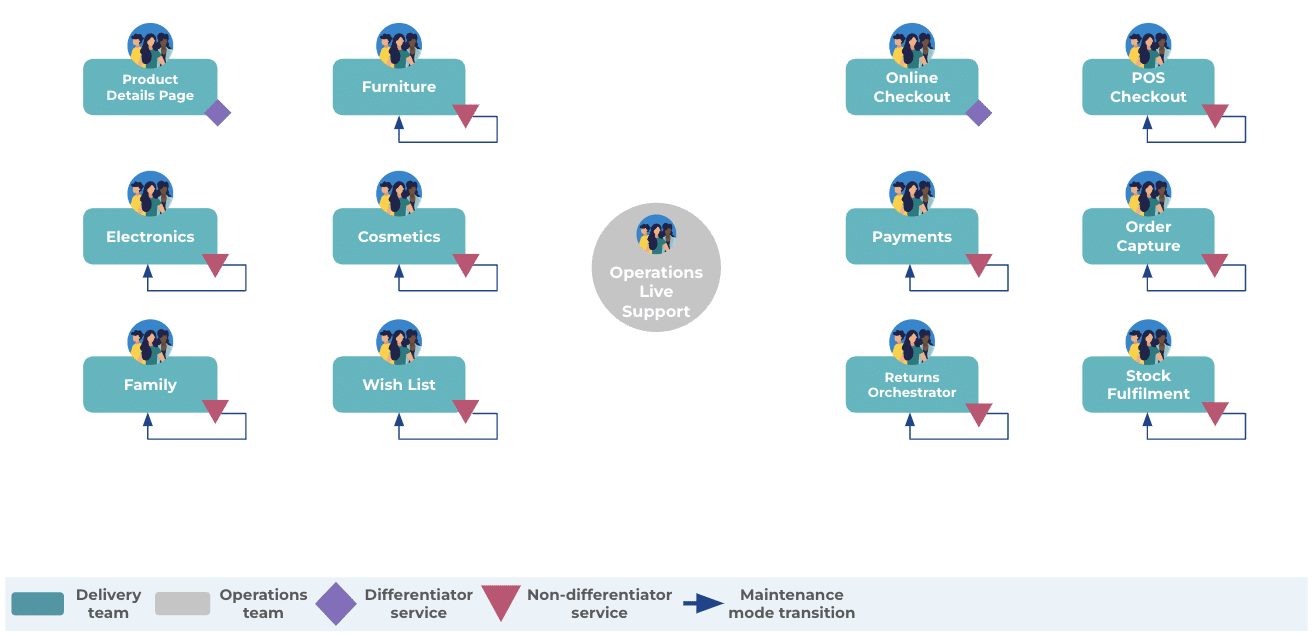
This solution has its benefits. It creates capacity for teams to start new propositions. The prior level of services reliability can be preserved, because teams have a low cognitive load, plus the technical skills and domain knowledge to complete maintenance tasks.
Future feature delivery is difficult, because delivery teams usually have separate business owners for their background and foreground services, so prioritization is difficult. And there’s little intrinsic job satisfaction, because teams don’t own outcomes. But the big disadvantage is you can’t easily resize or retire teams. That’s why our customers often believe dedicated teams aren’t value for money with zero demand services. This solution usually ends as soon as cost pressures begin.
Solution #2 – operations team
This is the traditional maintenance mode solution. Delivery teams transition their zero demand services into the operations team, who do maintenance tasks and live support for everyone. Here’s our American retailer again, with 11 teams reassigned, resized, and/or retired when their non-differentiators reach zero demand.
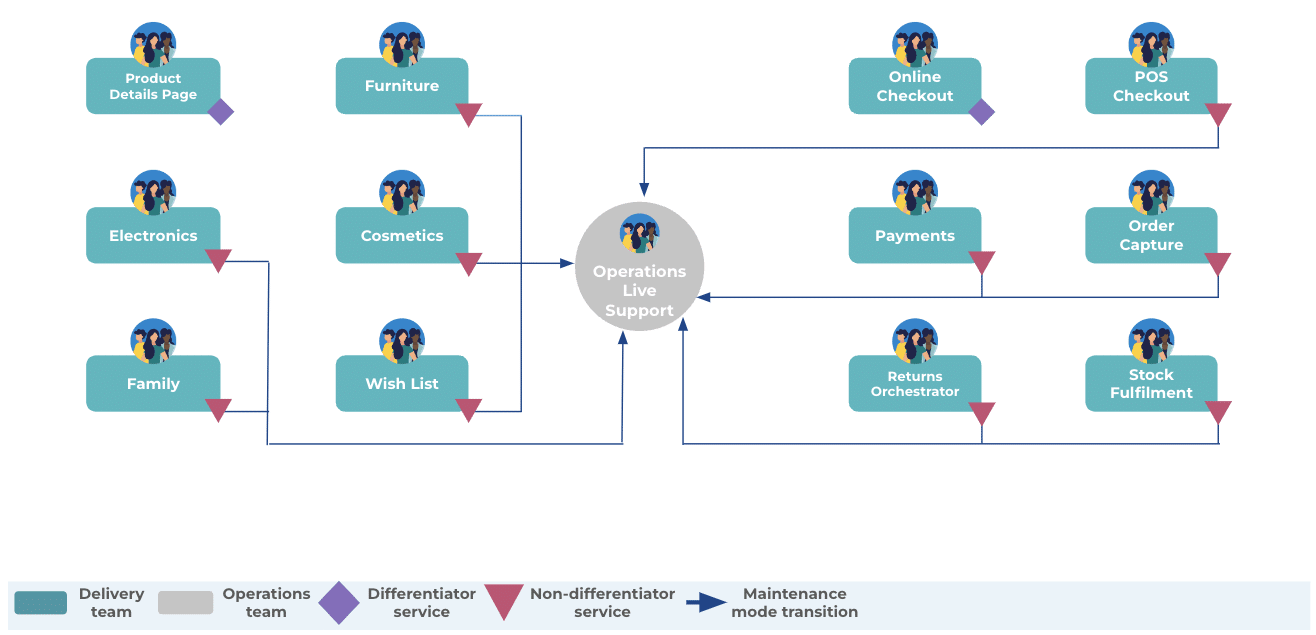
This solution is popular because it increases team capacity and reduces costs. In addition, the operations team can be outsourced for further cost savings. However, there are significant disadvantages:
- Live services reliability is weakened. Maintenance tasks are completed slower and to a lower standard than before. An operations analyst has a high cognitive load, with tasks for tens or hundreds of live services, because there’s no limit for an operations team. They might also lack the technical skills and domain knowledge for some tasks, like updating production code and tests after a library upgrade
- Future feature delivery is much slower. When planned features are required, they’re prioritized and implemented at a much slower rate than before. Live services maintained by an operations team have multiple business owners, so prioritization is really painful. Missing skills and domain knowledge also have an impact here
- Job satisfaction is damaged. There’s little intrinsic motivation, because delivery teams feel they’re in a never-ending feature factory, and operations analysts feel they’re in a never-ending dumping ground
A car repair company has its operations team running ePOS software in maintenance mode. Some team members lack the technical skills for library upgrades, and it delays performance improvements reaching payment tills. When new regulations are announced, there’s a reverse service transition into a temporary delivery team. When the functional changes are complete, there’s another transition back into the same operations team. It’s a time-consuming, costly process.
Solution #3 – multi-product teams
Our recommended maintenance mode solution is multi-product teams. It’s a logical extension to our preferred You Build It You Run It operating model, and it follows the same principle of outcome-oriented, empowered product teams. All zero demand services in a product family are transferred from their product teams into a multi-product team, staffed by developers. Here’s the American retailer with multi-product teams in two families of related domains.
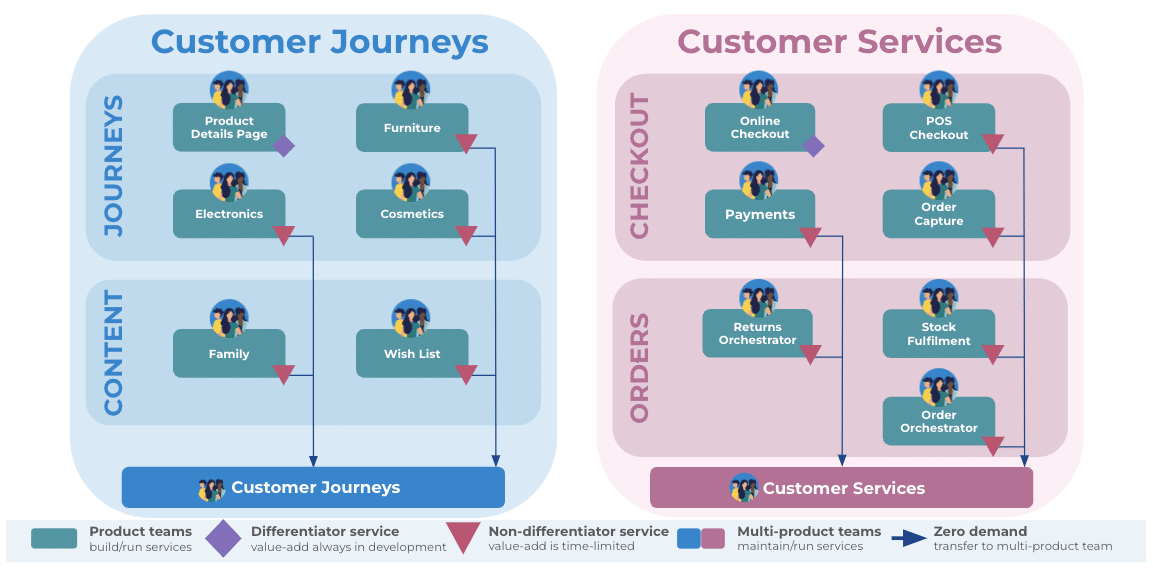
Multi-product teams allow capacity to be increased and team costs to be decreased, as one team per product family does all the maintenance work. The You Build It You Run It operating model ensures all teams have the necessary technical skills, operational incentives, and intrinsic motivation to protect live services reliability and future feature delivery as is. Cognitive load for a multi-product team is limited to product family size, and job satisfaction is boosted by accountability for user outcomes.
Guardrails are necessary, to counter any dumping ground preconceptions lurking in your organization. We suggest:
- Define zero demand. Describe it as a non-differentiating service with 3+ months of live user traffic, where the product manager has declared no more funding exists
- Create identity and purpose. Give a multi-product team the same name as its product family, to emphasize the team mission and focus on outcomes over outputs
- Document transfer criteria. Ensure the same criteria are used for transferring a live service between two product teams, or a product team and a multi-product team
Conclusion
In a DevSecOps world, you still need a maintenance mode solution. Your non-differentiating digital services and data pipelines can reach zero demand, and that’s OK. Just avoid the traditional maintenance mode solution of using your operations team. It’ll harm live services reliability, future feature delivery, and job satisfaction. Instead, create multi-product teams tied to product verticals, and ensure your developers are empowered to protect user outcomes.
