How to win at delivery assurance with Accelerate metrics
I speak with customers and consultants across the Equal Experts network, to help our customers solve scaling problems and achieve business agility. One topic that often comes up is delivery assurance, and it’s easy to get it wrong. Our preference is to automate and visualise the Accelerate metrics in a services portal, and use trends to identify assurance needs.
Delivery assurance is about identifying risks, generating insights, and implementing corrective actions, so your delivery teams can deliver business outcomes on time and to a high standard. And it’s challenging when teams are remote-first, in different offices, and/or in different timezones.
The easiest way to get delivery assurance wrong is to measure the wrong thing. Code coverage, story points, and velocity are good examples. They’re easy to implement (which might explain their popularity), but they’re team outputs rather than value stream outcomes. They’re unrelated to user value, offer limited data, and can be gamed by teams incentivised to over-report progress. People change how they behave based on how they’re measured.
At Equal Experts, our delivery assurance advice is the same whether you’ve got 1, 10, or 100 teams:
I once worked in a UK government department with 60 teams in 4 offices. In a meeting, I asked senior managers to write down which teams they were concerned about, and then showed them a new services portal with the Accelerate metrics. The data highlighted two teams quietly trending downwards, which nobody had written down. Corrective actions were adopted by the teams, and the customer was delighted with our delivery assurance. This is covered in-depth in a public conference talk, which you can see here.
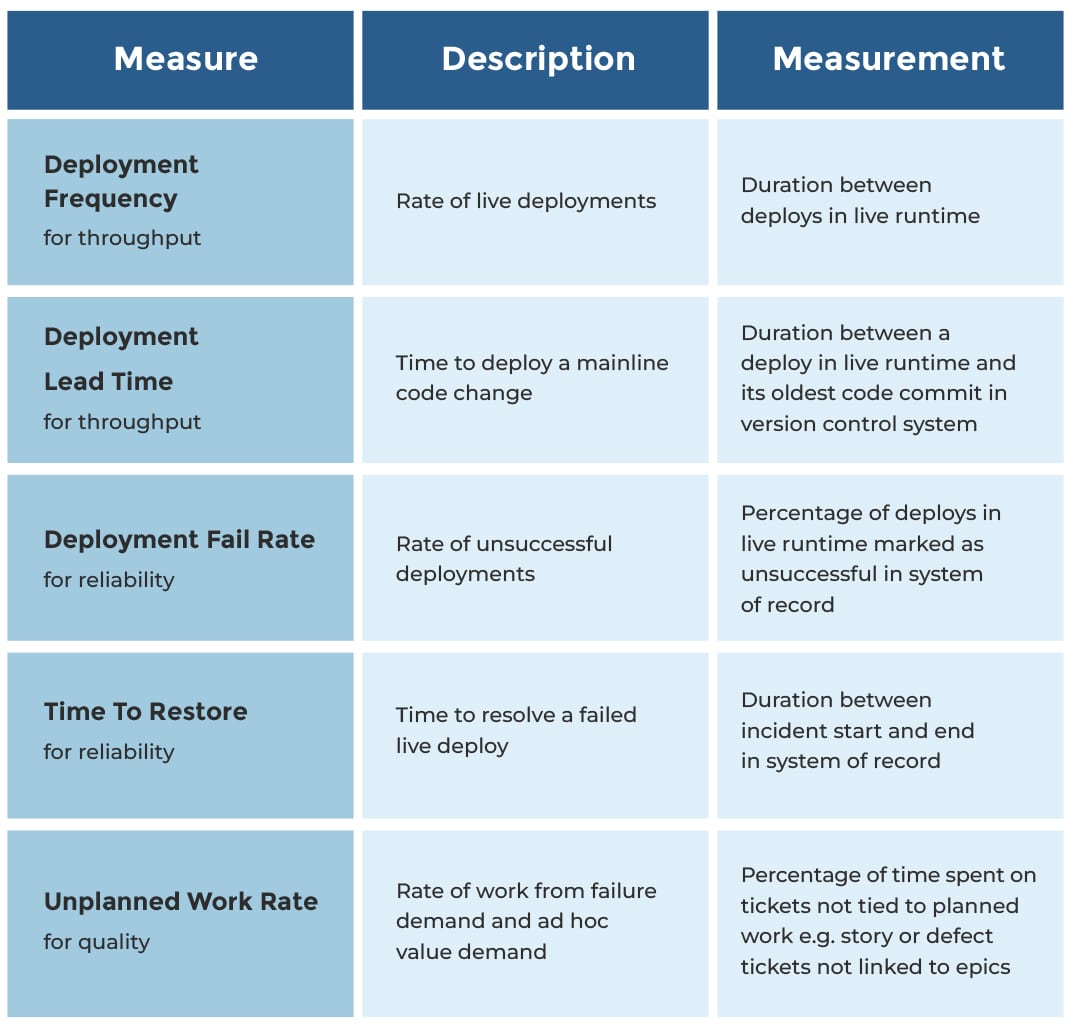
Automate the Accelerate metrics
The Accelerate book by Dr Nicole Forsgren et al is a scientific study of IT delivery. It defines the five Accelerate metrics – deployment frequency, lead time for changes, unplanned tech work rate, change failure rate, and time to restore service. They’re a great fit for delivery assurance because they’re value-stream outcomes, statistically significant performance predictors, and interdependent for success. For example, you can’t rapidly deliver features without a short lead time; that demands a high standard of technical quality, which is implied by a low unplanned tech work rate.
We recommend the Accelerate metrics to our customers. Unplanned tech work rate is particularly valuable, because it captures both ad hoc value demand and failure demand, providing a real view of team capacity and technical quality. In our experience, it’s often better to measure unplanned work than planned work, because planned work is frequently over-reported — and people change how they behave based on how they’re measured.
We automate these metrics for live services with monthly measurements. There are plenty of implementation routes: a live runtime could be EKS or Cloud Run, a system of record could be ServiceNow or Fresh Service, and a ticketing system could be Jira or Trello.
If you don’t have any live services yet, we’d advise frequent deployments of your in-development services into a production environment sealed off from live traffic, and still using these same metrics. And if you aren’t able to do that, it’s still worth measuring unplanned work rate, as it tells you how much time your teams are actually building planned features, versus fixing defects and reworking features without user feedback. That’s always good to know.
Visualise the data in a services portal
A services portal is a dynamic knowledge base for your organisation. It’s a central directory of teams, services, telemetry, change requests, deployments, incidents, and/or post-incident reviews. It replaces all those documents, spreadsheets, and wiki pages that quickly fall out of date.
You might know this as a developer portal from Spotify Backstage, a popular open-source framework for building portals. We’re fans of Backstage, and prefer to talk about services portals to emphasise knowledge bases are for everybody, not just engineers.
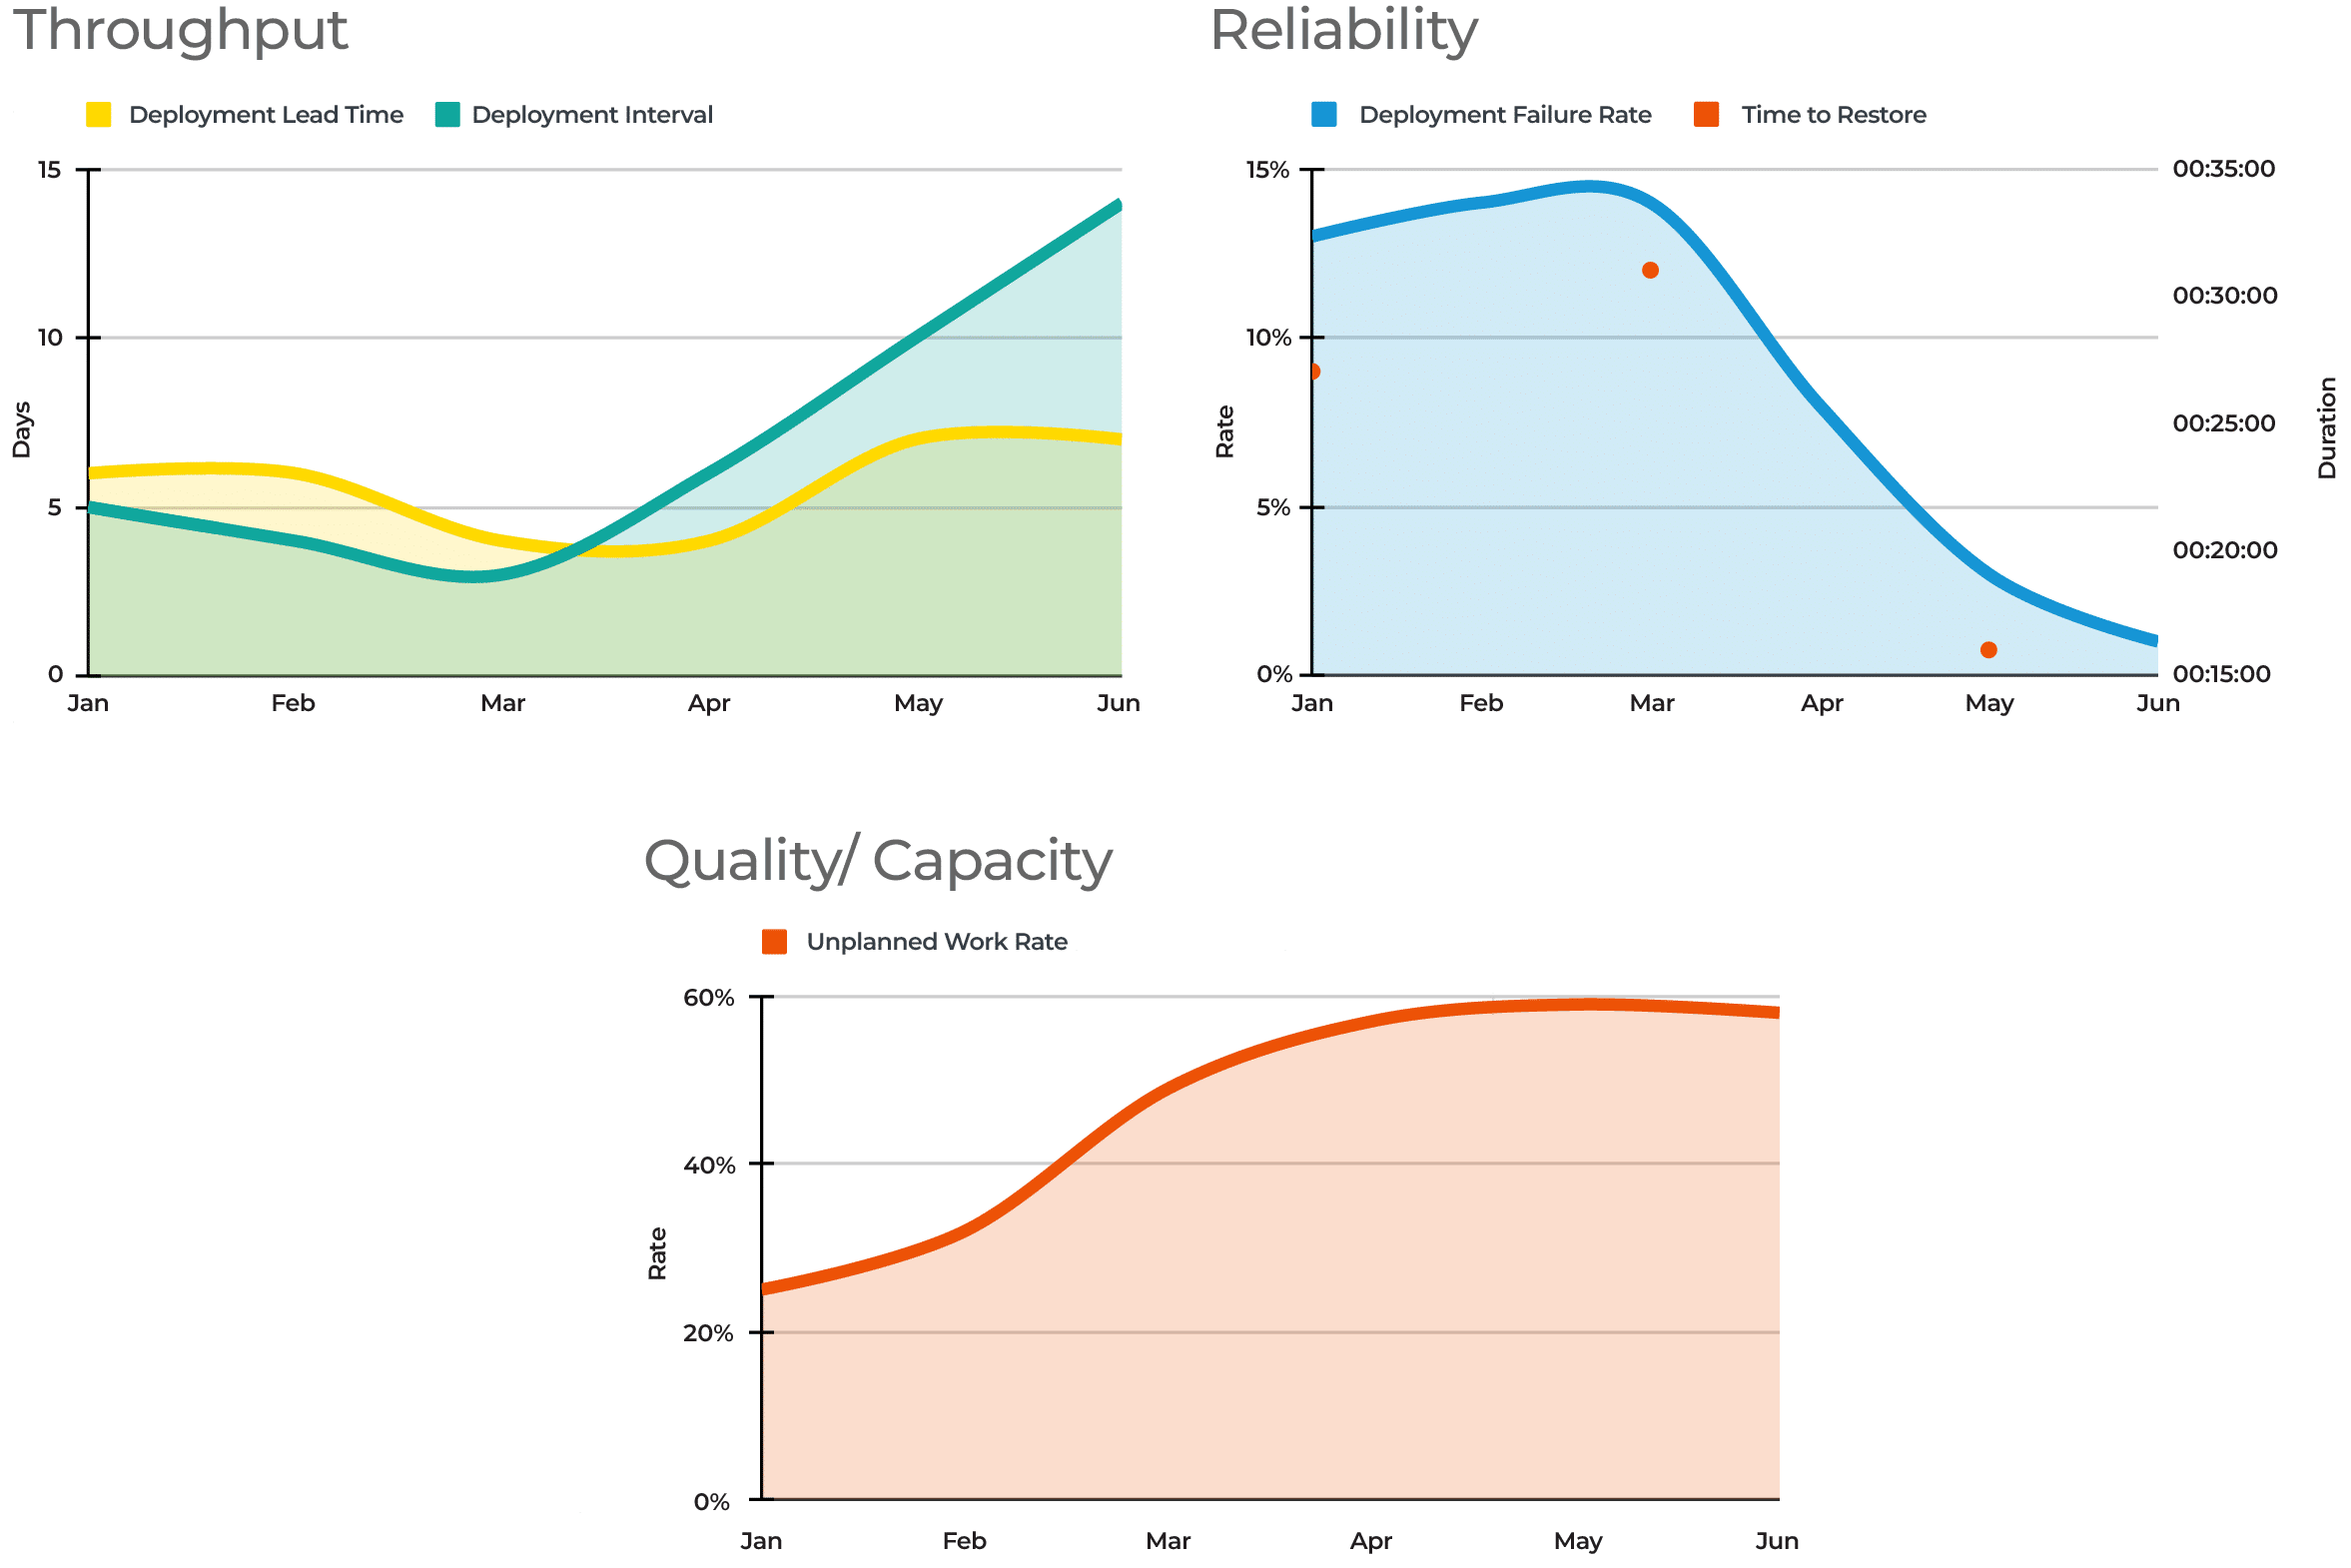
Delivery assurance can be implemented in your services portal. It can suck out all the necessary data from your version control system, system of record, ticketing system, and live runtime. Each service page can include Accelerate metrics, so you can see if a service is trending in the right direction. Those metrics can also be aggregated on each team page. Here’s what those Accelerate metrics might look like.
Yet again, people change how they behave based on how they’re measured! Always put the Accelerate metrics for one service or team on one page. Don’t put metrics for two services or two teams on one page. You’re encouraging teams to continuously improve based on their own efforts, not compete against other teams with different contexts and constraints.
Use trends to identify assurance needs
Visualising the Accelerate metrics in a services portal brings delivery assurance to life. Different team and service pages will show which teams are continuously improving, and which teams are unwittingly sliding in the wrong direction. You’ll understand where investing additional time and effort can put teams back on the right track.
Metrics tell you where to find the most valuable stories, not what the stories are. The above graphs show a delivery team where throughput and unplanned work are worsening, and failure rate is improving. But the metrics don’t explain why this is, and there’s plenty of potential reasons – a slowdown in planned features, an increase in test environments, or a new hard dependency. It’s important to listen to teams with assurance needs, and understand their situation in detail.
A Developer Experience (DevEx) team is a logical choice to own a services portal and its Accelerate metrics. They can also consult with teams to understand their assurance needs, and offer assistance where required. It’s a supportive, broad role that is best suited to expert practitioners who’ve previously worked on delivery teams in the same organisation.
Conclusion
Delivery assurance is important, and it’s easy to get it wrong by measuring team outputs. The Accelerate metrics by Dr. Nicole Forsgren et al are statistically significant predictors of IT performance, and it’s relatively straightforward to automate their measurements and visualise them in a services portal. It’s then possible to see at a glance which teams are headed in the wrong direction, and offer them assistance from expert practitioners in a Developer Experience (DevEx) team.
You may also like
Blog
Migration and modernisation options for your heritage services – Rethinking the AWS 6Rs
Blog
Heritage services: What they are and why we love them
Blog
3 Spooky Software Monsters To Avoid All Year Round
Get in touch
Solving a complex business problem? You need experts by your side.
All business models have their pros and cons. But, when you consider the type of problems we help our clients to solve at Equal Experts, it’s worth thinking about the level of experience and the best consultancy approach to solve them.
If you’d like to find out more about working with us – get in touch. We’d love to hear from you.