How I created a tool to help you find where to “Eat Out to Help Out”
This post describes how I developed the Discount Dining Finder, a lookup map tool for the Eat Out to Help Out scheme in my spare time. The aim of this post is to provide an insight into how problems of scaling services can be solved by having no servers and not using “serverless services” either.
Aperitif
A really nice side effect of working in a high functioning environment is that sometimes you’re involved in bouncing ideas off each other. The delivery teams at HMRC were working on releasing yet another service to the public in less time than it takes you to say “Agile”. This scheme was called Eat Out to Help Out.
The scheme would consist of different journeys:
registering a restaurant,
searching for registered establishments for the public and
making claims for payment.
Out of these three, the biggest unknown in terms of expected volume was the “search journey” to be used by the general public. In this journey, a user would enter a postcode, and registered establishments inside an X mile radius would be displayed. There was a large number of unknowns in terms of how much traffic was to be expected on the HMRC service.
Would there be big peaks at lunchtime or dinnertime?
What if Martin Lewis goes on TV, recommends visiting the site and the, two minutes later, 10% of the country wants to find out information about their local eateries?
Could it impact other HMRC services (the tax platform hosts a multitude of services)?
Now, the tax platform is a very scalable and robust platform and I am not for one minute suggesting that there was going to be a problem using microservices and geo-location in Mongo at scale, but one of the ideas that I floated centered around the fact that the information is fairly static. Sure enough, “eat out” businesses register their premises with HMRC, but once they are registered, the bulk of information will not change. Postcodes and distances between them are not that changeable. So that’s when I wondered, whether this could be delivered in a static site.
Starter
I went away and found that freemaptools provides me with a list of UK postcodes and their associated latitude/longitude. In that file, there are 1,767,875 postcodes. Searching almost 2 million records sounds like the job for a server and a database, doesn’t it? Erm, no.
Each file is split into directories by their first letters. So if I want to find out about postcode AB12 4TS, I’d split up the the outcode (AB12) into /A/B/AB12.csv. That file would only have 799 entries. Searching them manually is much more palatable.
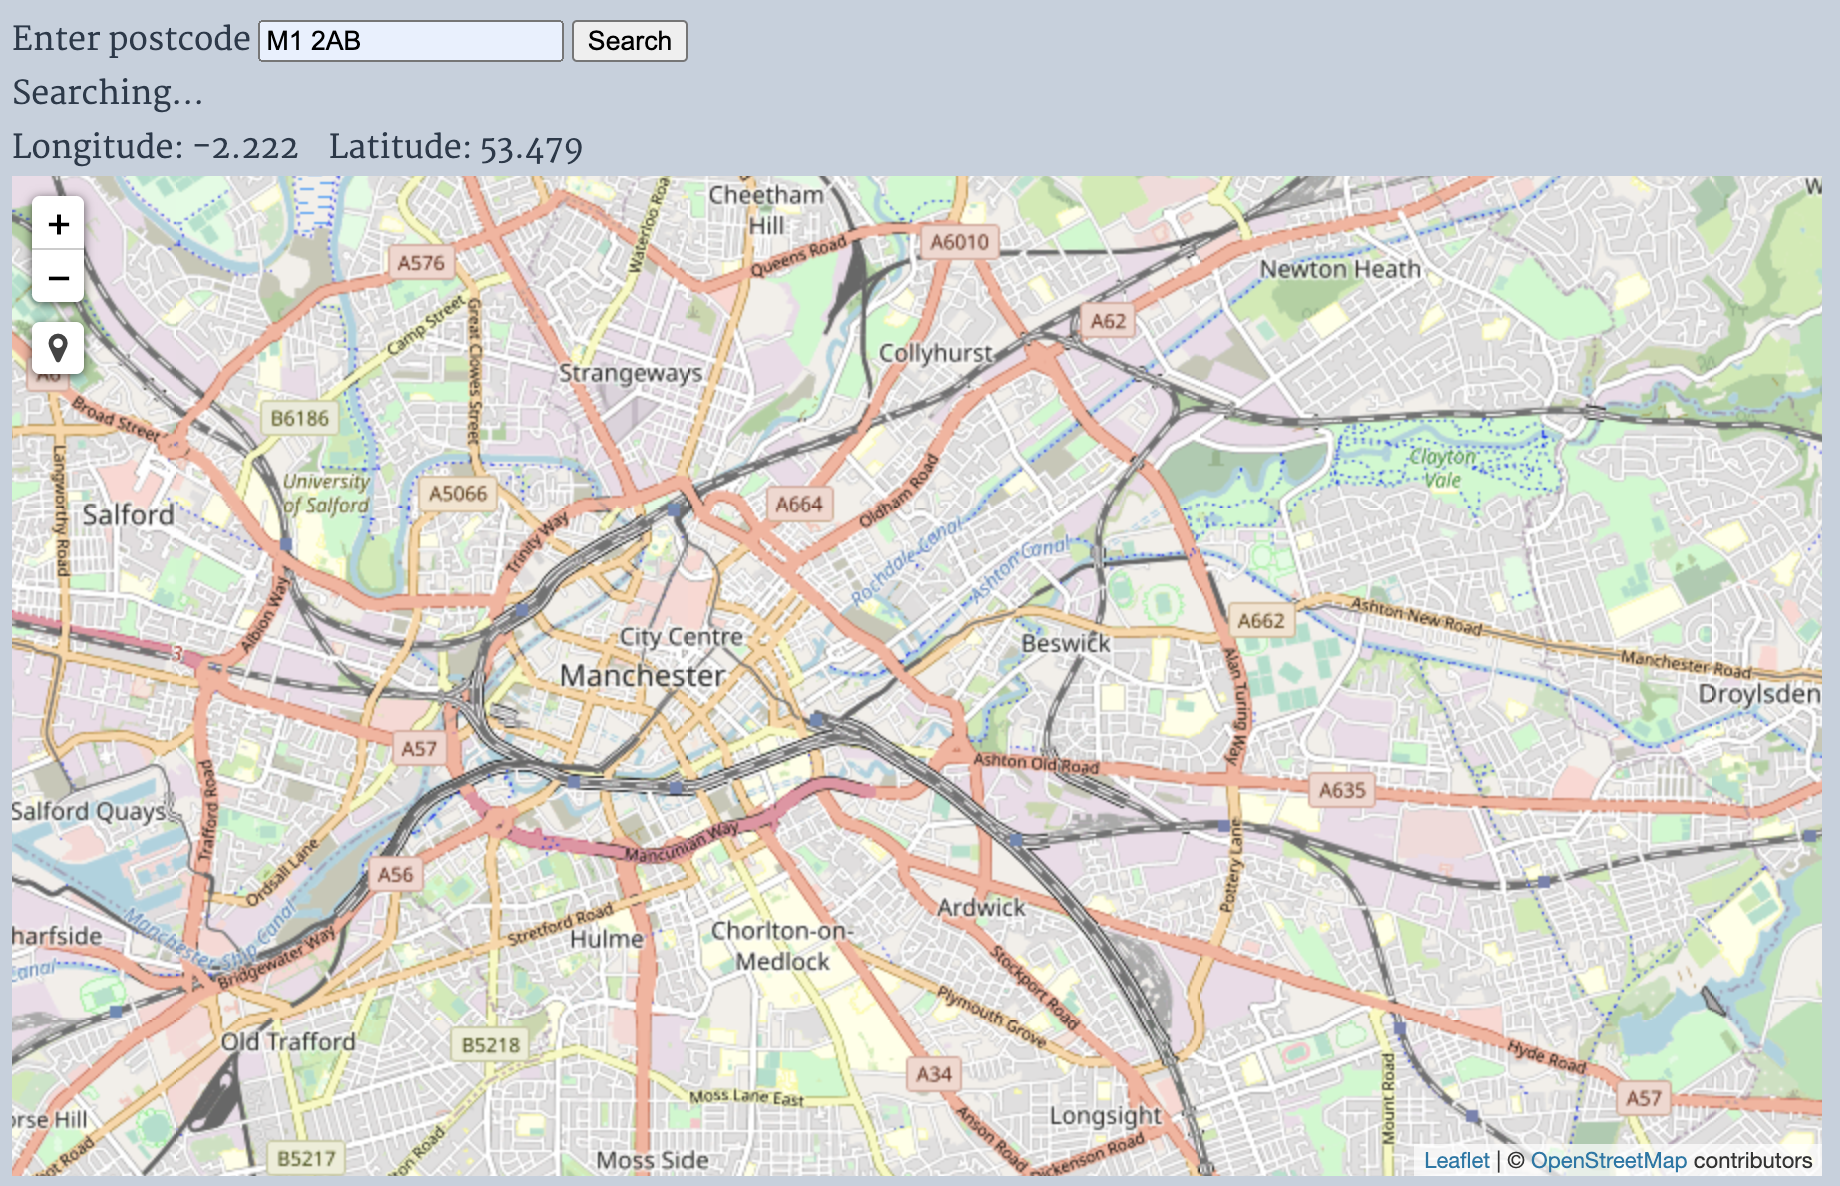
So I’ve got my main page and the user would enter their postcode
And I can search for the postcodes simply by using a bit of Javascript inside the user’s browser.
d3.csv("outcode/"+outcode[0]+"/"+outcode[1]+"/"+outcode+".csv").then(function(postcodes){result=postcodes.find(d=>normalisePostcode(d.postcode)===postcode);if(result){d3.select("#status").text("");mapid.panTo(newL.LatLng(result.lat,result.lon));}else{d3.select("#status").text("Postcode not found")}})
D3 is a great library for visualisations, but I also found it very useful for reading and processing CSVs in Javascript, and the files can be served up by a static web server.
Great! But how do I get my directory structure? I did not fancy manually copying and pasting the file. You think that surely now is time to unleash some NoSQL database or at least some Python. But no, I decided to keep it simple and use a combination of shell scripts and AWK:
This resulted in 2,980 files. The biggest of those was 145KB which corresponded to 2,701 postcodes. Now that’s much better than looking up 1.7 million postcodes for every search!
Soup
I didn’t mention the Discounted Dining Finder had a map. A quick overview on setting that up!
I used LeafletJS – an open source map. Here’s how:
That map didn’t have anything on it yet! I was able to convert a postcode into lat/lon though. The next step was to look up the restaurants. I decided to keep running with the idea of doing all my computations on the user browser (desktop or phone).
First of all, I found that the UK postcodes were covering an area of:
$ cut -f3 -d, ukpostcodes.csv | awk -F, 'BEGIN { max = -999; min = +999; } /[0-9.-]+/ { if ($1 > max) max = $1; if ($1 < min) min = $1; } END { print min, max; }'
49.181941000000000 60.800793046799900
$ cut -f4 -d, ukpostcodes.csv | awk -F, 'BEGIN { max = -999; min = +999; } /[0-9.-]+/ { if ($1 > max) max = $1; if ($1 < min) min = $1; } END { print min, max; }'
-8.163139000000000 1.760443184261870
I calculated that the rectangle (60.80 N/-8.16 W) – (49.18 N/1.76 E) covered about 400 miles from west to east and 800 miles from north to south. My aim was to provide a lookup that could find all restaurants in a 5-mile radius, so I split my search area up into tiles of roughly 5×5 miles. Here’s my translation function:
That would give me a coordinate set for a tile. So the Buckingham Palace (51.5 N/-0.14 W) would be at coordinates (33/64). Based on that, I could build another set of files:
Whereby all the eateries that are in coordinates (33/64) would be in the file pubgrid/33/33-64.csv. That file would look like this:
name,postcode,lat,lon
blue racer and frilled lizard,BR1 1AB,51.406270892812800,0.015176762143898
saltwater crocodile and blue racer,BR1 1LU,51.401706890000000,0.017463449000000
king cobra and Schneider python,BR1 1PQ,51.406421920000000,0.012595296000000
The javascript can then find the suitable restaurants like so:
d3.csv("pubgrid/"+x+"/"+x+"-"+y+".csv").then(function(pubs){letinRange=pubs.map(a=>({ ...a,distance: distance(result,a)})).filter(a=>a.distance<(5 * 1609.34)).sort((a,b)=>a.distance-b.distance).slice(0,250)d3.select("#results").selectAll("tr").data(inRange).join("tr").selectAll("td").data(d=>[d.name,d.postcode,(d.distance / 1609.34).toFixed(2)+" miles away"]).join("td").text(d=>d)markerLayer.clearLayers();inRange.forEach(d=>L.marker([d.lat,d.lon],{"title": d.name}).addTo(markerLayer))})
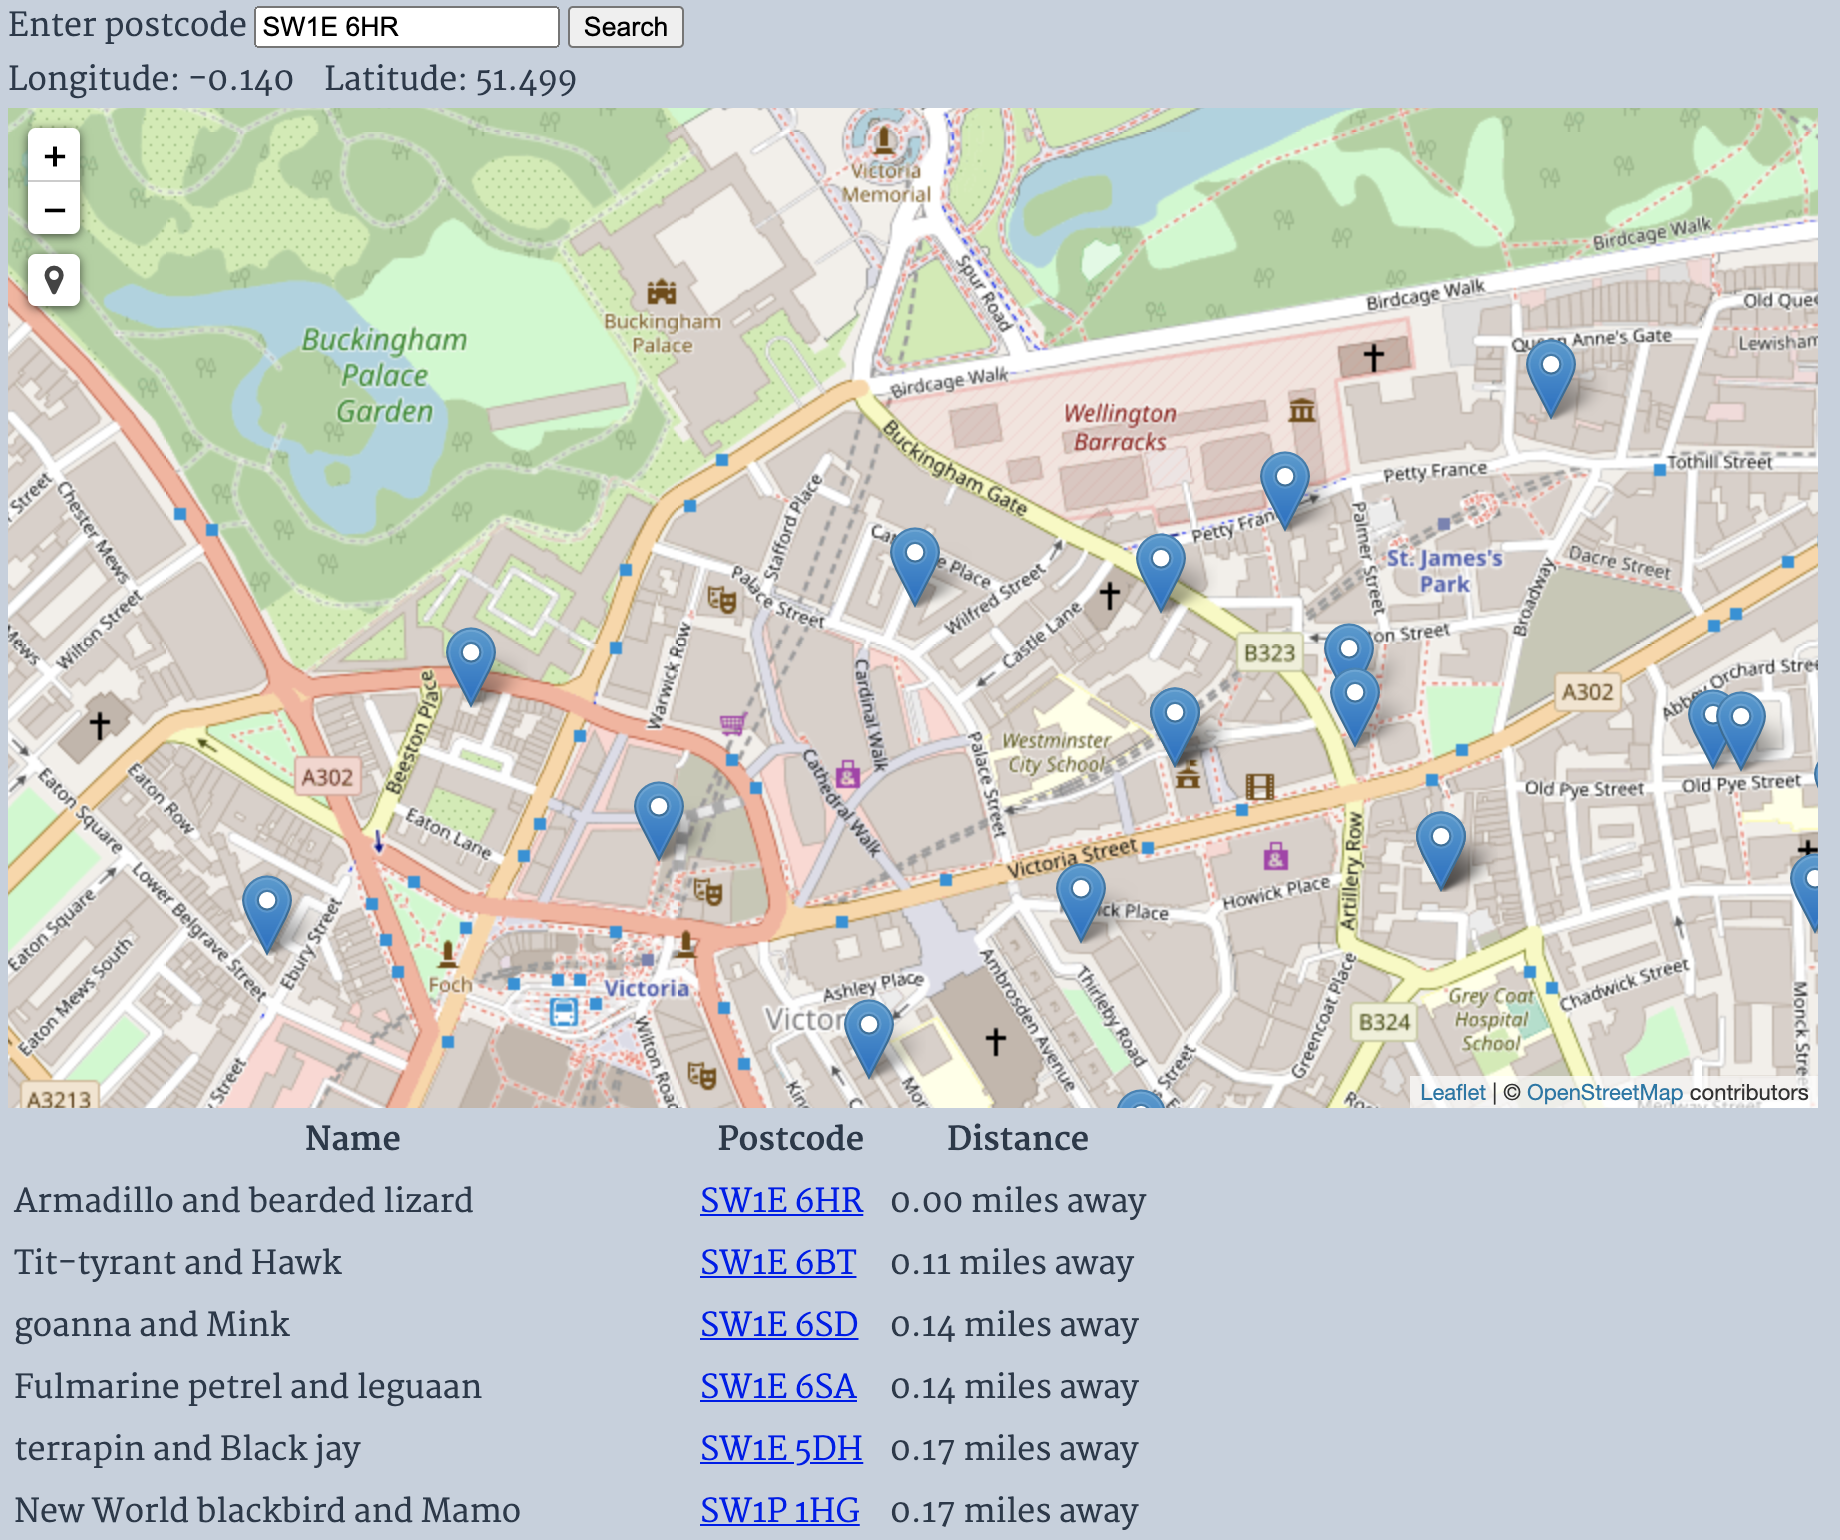
The above code does a few things:
It calculates the distance between the selected lat/lon and the lat/lon for the restaurant.
It filters out anything that is further away than 5 miles.
It sorts by distance, so that the closest are first.
It takes up to 250 results.
It can dynamically create a table that shows the results (this is very neat using D3)
It can clear and recreate all the markers on the map.
The end result looks a little like this:
Meat
Now, the next tricky bit is to ensure, that my coordinate grid system, which simplifies into coordinates (lat/lon), contains all the relevant information about the closest eating establishments. Each tile is designed to be about 5×5 miles. In order to ensure that we find every restaurant that is 5 miles away from each tile, each restaurant goes into the tile it is in, as well as the surrounding tiles. This is done using trusty AWK:
functionprint_to_file(file) {
if (headers[file] != "done") {
print "name,postcode,lat,lon">> file;
headers[file] = "done"
}
print $0>> file;
close(file);
}
{
x = int(($3-49.0) / (12.0/160.0))
y = int(($4+9) / (11.0/80.0))
file_tl="target/pubgrid/" (x-1) "/" (x-1) "-" (y-1) ".csv";
file_tm="target/pubgrid/" x "/" x "-" (y-1) ".csv";
file_tr="target/pubgrid/" (x+1) "/" (x+1) "-" (y-1) ".csv";
file_ml="target/pubgrid/" (x-1) "/" (x-1) "-" y ".csv";
file_mm="target/pubgrid/" x "/" x "-" y ".csv";
file_mr="target/pubgrid/" (x+1) "/" (x+1) "-" y ".csv";
file_bl="target/pubgrid/" (x-1) "/" (x-1) "-" (y+1) ".csv";
file_bm="target/pubgrid/" x "/" x "-" (y+1) ".csv";
file_br="target/pubgrid/" (x+1) "/" (x+1) "-" (y+1) ".csv";
print_to_file(file_tl);
print_to_file(file_tm);
print_to_file(file_tr);
print_to_file(file_ml);
print_to_file(file_mm);
print_to_file(file_mr);
print_to_file(file_bl);
print_to_file(file_bm);
print_to_file(file_br);
}
But wait a minute, that presupposes that I have a list of pubs and their coordinates. That’s not the case; all we’ve got is the establishment name and their postcode. Thankfully there’s a shell command that I can use to join my existing postcode file and a file of establishments and their postcodes:
sorts both the pub_postcode.csv (containing name and postcode),
sorts the ukpostcodes.csv (containing the postcode and lat/lon) and
joins the two files, creating one file in which the lines are joined by the postcode.
Palate Cleanser
You will have noticed above that my examples aren’t using real pub or restaurant names. At the time of writing HMRC had not yet published the list of registered restaurants, so I used my shell scripting knowledge (and a lot of googling) to create a fairly neat way of generating random pub/restaurant names.
I took a list of animal names and randomly combined them with “and”, the aim being to get the “Fox and Badger” and endless variations.
creates another 100,000 random animal names (in a different order)
creates 100,000 instances of “and”,
and combines them all, resulting in my randomly generated pub names.
$ head pub_postcodes.csv
leguaan and bushmaster,B79 7SP
anaconda and Moluccan boobook,CM20 2GN
flying lizard and hoop snake,NW4 3LY
Towhee and agamid,LL11 6NN
Puffleg and Gila monster,OX12 0FE
mamba and Chipmunk,UB6 7AH
Eagle and Marsh harrier,FK1 5LE
Jay and chameleon,KA19 7NW
B and Maya,L5 7UB
ringhals and Diving bird,W9 2EH
Dessert
All of the above is very good, but I’ve still not hosted my tool anywhere, and I don’t want to use my own servers. Thankfully, github.com provides GitHub Pages and GitHub Actions which can be combined to provide a build pipeline and a hosting solution!
Cheese
Thanks for reading, I hope you found the Discounted Dining Finder and the above tale interesting. The source code is available on github.com/beny23/static-distance/ and released using the Apache-2.0 open source licence.
Get in touch
Solving a complex business problem? You need experts by your side.
All business models have their pros and cons. But, when you consider the type of problems we help our clients to solve at Equal Experts, it’s worth thinking about the level of experience and the best consultancy approach to solve them.
If you’d like to find out more about working with us – get in touch. We’d love to hear from you.