Smoothing the Continuous Delivery Path: Monitoring and Responding
The previous article in this series on Continuous Delivery explored what your system’s vital signs might be, why they matter and how to identify them.
Monitoring your production system’s vital signs can significantly improve your organisation’s Continuous Delivery ability – this post explores why this is, and how to notice problems well before your system flatlines.
Finding your system’s pulse rate
Various tools exist for collecting and displaying this data. Google Analytics is great for business level metrics. For service and resource metrics, New Relic or its equivalents are hassle-free (but pricey); a lower cost set-up is the ELK stack (elasticsearch, logstash, kibana) – though slightly more work to implement.
He’s dead, Jim!
If no-one notices a patient’s cardiac monitor heading towards a flat line, the situation will soon become pretty hopeless. Tracking a system’s vital signs is only worth doing if changes are noticed and responded to. The best people to respond to a change in a production service are the people in the product team that built it – they are the most familiar with the system’s inner workings and nuances. The challenge is getting these vital signs in front of the team, and habitualizing their monitoring of them. This can be done using real-time visualisations and alerting.
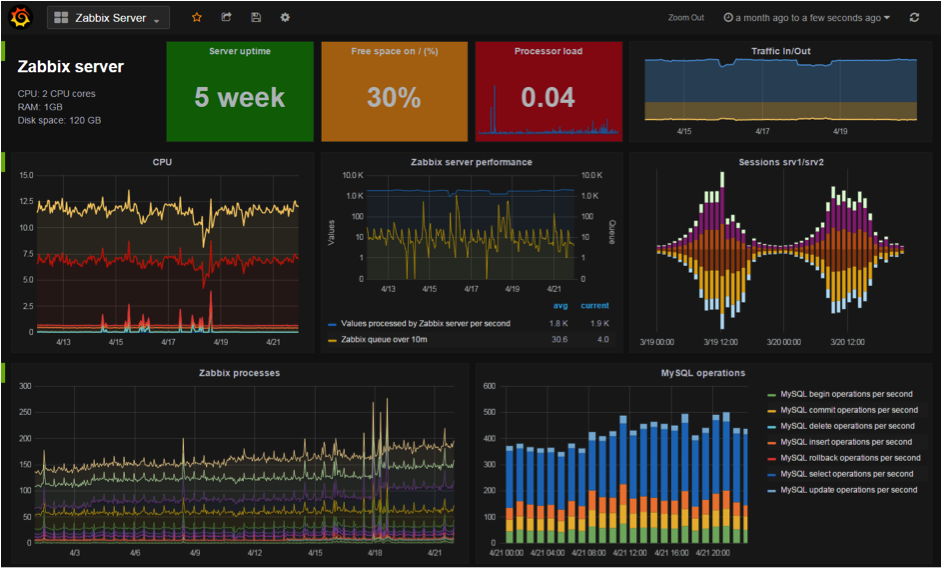
Real-time visualisation
If a team has a system in production, it needs direct sight of how it’s doing. Having live graphs on wall-mounted displays in the team area is a great way of doing this. Go for simple graphs though, that each show a trend and one headline number, much like those displayed on a cardiac monitor. A single number per display is much easier to become accustomed to, and makes it easier to notice a variation that may cause concern. Over time, the team will become familiar with how this one number varies across the day, week and year, much like a doctor building up the medical history of a patient.
Another recent post on the Equal Experts blog shows a great example of this in action.
Alerting
Real-time visualisations are great, but you don’t want to rely on someone noticing a variation on a dashboard to realise your service is down.
Automated alerts kick in when a pre-defined threshold is reached, and are thus an essential part of any system’s health monitoring. There are two key considerations with automated alerting:
Tuning them so that alerts only fire when something needs investigating. A constant stream of alerts will quickly be muted by its recipients and forgotten about.
Minimising the cognitive cost of receiving the alert, and knowing how to respond. Ideally, the alert needs to contain clear, concise information that tells the recipient what’s gone wrong, and what steps should be taken next.
Developing Continuous Delivery is all about making small, incremental improvements to production code – and thus user experience – and an ability to monitor and respond to your system’s vital signs is a key part of the cultural practices necessary to make it work.
I hope you’ve found this series interesting. I’ll be speaking on the topic of Continuous Delivery in more detail at Agile on the Beach in Cornwall – do say hello if you’re there!
Get in touch
Solving a complex business problem? You need experts by your side.
All business models have their pros and cons. But, when you consider the type of problems we help our clients to solve at Equal Experts, it’s worth thinking about the level of experience and the best consultancy approach to solve them.
If you’d like to find out more about working with us – get in touch. We’d love to hear from you.