If you’re familiar with the
Theory of Constraints – or you’ve simply worked for long enough in delivery teams – you’ll be aware of the cost of constraints (or bottlenecks).
In short, a team can only go as fast as its slowest constraint. Here’s a hypothetical scenario where a team might be constrained:
- Your test and release process is manual and handled by another team, which requires advance notice to work with your release; say, a week to test and (where tests are successful), a further day or two to release.
- Testing depends on their manual setup of test data across multiple servers, so your team must provide an accurate written explanation of what data needs to be setup, along with detailed test scripts.
- Release depends on approval by the Release Board that meets once a week, and you need to provide detailed release documentation for them to review.
A scenario like this could result in teams releasing less often. Perhaps only a few times a year.
The best way to deal with such an impediment is to expose it, focus on it with your team, and gradually remove it. And there are a number of really simple methods to expose issues a team might be feeling.
Driving out the constraint
The first step to solving a problem is realising it’s there in the first place. A simple agile board is a fine way to do it.
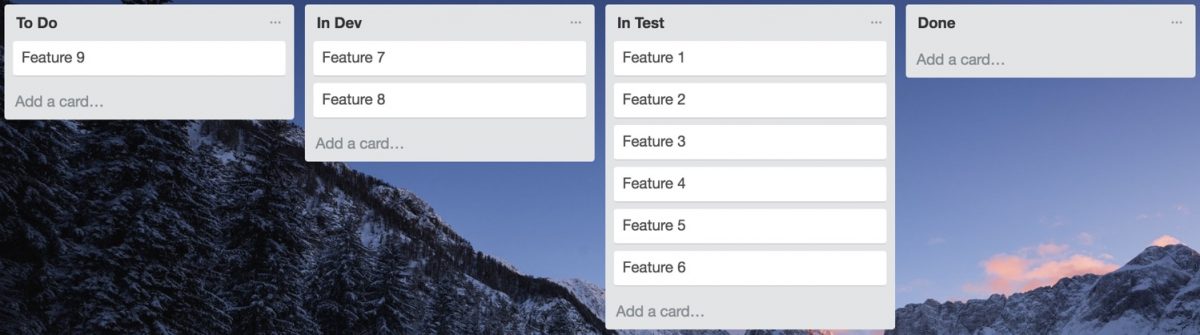
Our team used a very simple board to track work as it went through the system – initially just using the columns To Do, In Progress and Done.
Over time, work began to bottleneck in the In Progress column. This wasn’t enough to clarify where the bottleneck was, but as we’d anecdotally been feeling some pain around testing, we created a new In Test column. This simple change quickly highlighted just how much work was stuck in test; constraint identified.
We huddled around the constraint and, rather than limit our focus to only getting these specific features into production (although that was a key goal), we also widened our focus and accepted that there was a systemic issue that required dedicated attention.
Although a test-first mentality had been established within our immediate team, our dependency on an external test and release process was limiting our ability to go into production. We needed to lessen that dependency in order to speed up our own ability to deliver.
Make the problem obvious
Visualisations don’t need to be sophisticated to be useful.
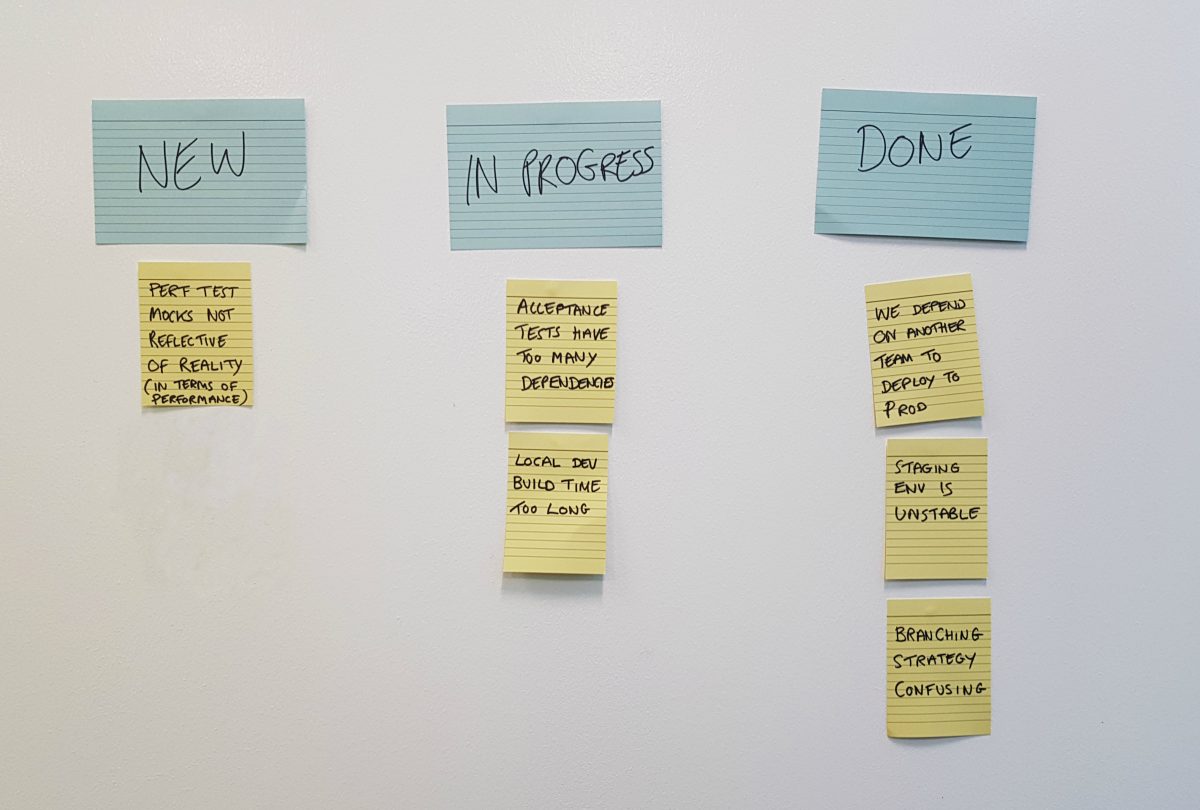
Another way we tried to drive forward our culture of dealing with impediments early was to expose them, centre stage, via a dedicated Impediment Wall. Here, the team was encouraged to place impediments, so they could be discussed and resolved. It wasn’t complicated, it wasn’t pretty, but it was highly visible – and enough to ensure impediments couldn’t be ignored:
Visualising environment stability blockers
At Equal Experts, our goal is to release into production early, and often. Even if it’s just a “Hello World” to begin with, we want to be sure that our delivery pipeline is clear as soon as possible; a release is only “Done” when it’s in production.
Of course, reality isn’t always that straightforward. All teams face deployment constraints.
So visualising the blockers in the wider deployment environment is an excellent way to maintain the team’s focus on constant delivery into production – by exposing and removing those constraints.
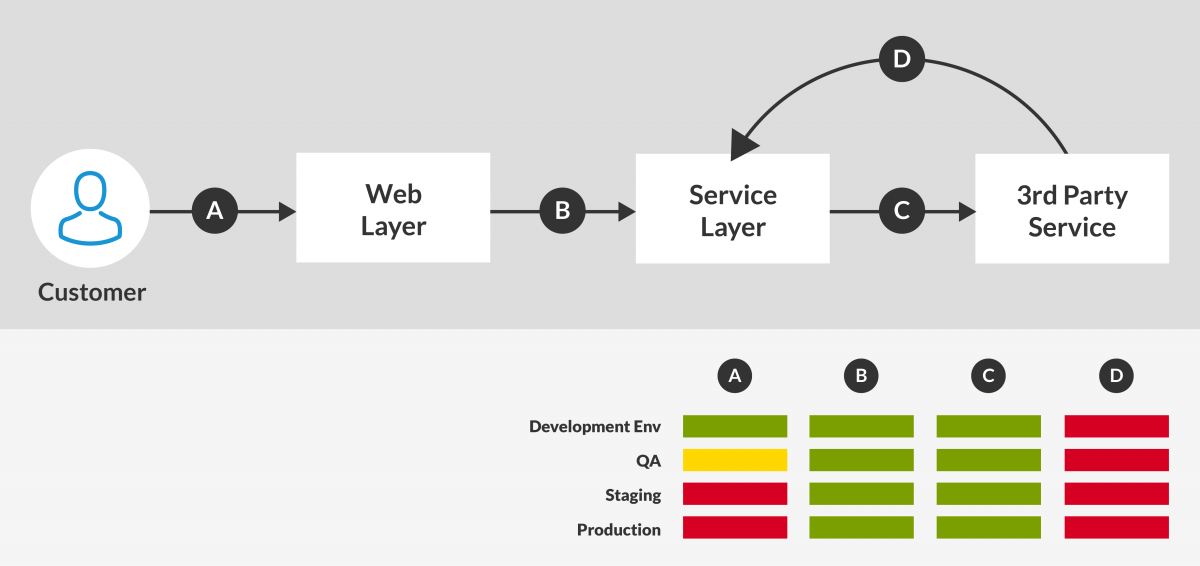
The best visualisation I’ve seen of this was shown to me recently by Chris Wood, an Equal Experts colleague working as a Business Analyst on a different engagement. This simple diagram was put onto a Confluence page, where it was easy to edit by the whole team:
It provides a clear view of where delivery blockers exist, and exposes the issues brilliantly, enabling the team to huddle and focus on resolving them.
Remember: nothing is impossible
One thing I’ve noticed when visualising blockers is that sometimes a team will accept a systemic issue as if it’s somehow immovable – especially if it involves another team, and/or things have functioned that way for a long time.
We showed that focusing on the problem together makes anything possible. With a mix of improved cross-team working relationships, the addition of more mock services that we controlled (greatly reducing the dependency), and a cultural change toward contract testing (rather than end to end testing), collectively we were able to greatly lessen the constraint and go live multiple times a day.
None of this would have been possible if we hadn’t exposed the bottleneck in the first place – only then could it be dealt with in this systematic manner.