How to evolve a client’s data strategy solution to provide more business benefits than ever before
When Equal Experts started a project for a mass media and entertainment conglomerate in the US, its initial goal was clear.
To collect digital assets (videos), metadata from different external providers, aggregate them in a single repository, and map them to an industry standard unique identifier. This identifier is required for the assets to be available on Video On Demand platforms.
But as you probably gather from the title of this article, as the project evolved, so did the solution. Because, as the project evolved, it became necessary to collect more data related to the assets’ supply chain, and the work started to be more focused on data. With this direction towards data, the EE Data Studio performed a Data Health Check with the rest of the development team. And, to address the challenges uncovered by the health check, our customer increased the team to include data engineers permanently.
What is a Data Health Check – and why is it necessary?
Performed over the course of two weeks, aData Health Checkis an assessment using quality metrics focussed specifically around data. The resulting health check provides a list of recommendations and improvements which a client could use to evolve their data platform.
Identifying immediate areas of improvement
As a result of the initial health check, we uncovered business rules spread and replication across the views and reporting tool – meaning a low level of reliability and confidence in the analytics data. This included the following:
Some data was being collected manually, with CSVs imported directly into the production database
The analytics data was being generated by several materialised views which included untested business rules
The views were only being refreshed once per day, so the lag between production and analytics was 24 hours
The data analysis and reporting was spread across multiple reporting tools: Metabase, Tableau, MS Excel
The initial step was to automate all manual data ingestion processes. Shortly after, we replaced the materialised views with tables that are updated incrementally with just the new ingested data.
This improvement alone reduced the data lag – from production/ingestions to analytics reports – from 24h to 2h.
Next, to increase the analytics uniformity, we recommended a single reporting tool, removing the need to have manual extractions of data between reporting tools. We chose Metabase because it provided multiple features which fitted the client’s needs:
Report creation using native SQL queries
Ease in creating multiple dashboards with multiple reports
Slack and email notifications
Allowance of dashboards to be embedded on external sites
Good user management
Work with Metabase, also identified that it could also be used as an anomaly detection tool. Through creating several reports, and using Slack and email notifications, we were able to implement anomaly detection for the most important business metrics.
Looking for more business benefits through the effective use of data
The result of these changes meant we were able to address the major challenges and increase the reliability of analytics. However, there was still room for improvement.
Roughly a year later we proactively undertook a Data Health Check Revisit where senior management were given full site of the progress, and further areas for improvement. It was important to understand the business value the next level of changes could represent and the client understood and recognised the need for these new recommendations.
How a data pipeline tool helped to realise improvements
Up until this point, all ingestions and the associated scheduling were set up inside a single Clojure project, with the management being done via configuration files within that project. This limited the flexibility to change a scheduler or trigger an ingestion. This meant a new deployment was needed.
A key focus on the next level improvements, was to address that limitation and be able to easily execute the following tasks:
Schedule data ingestions
Manually trigger data ingestions
Perform data backfills for specific ingestion
Easily see an overview of the status of all running ingestions
A data pipeline tool or orchestrator was the most suitable to realise these improvements. From the currently available solutions, we devised a shortlist for comparison:
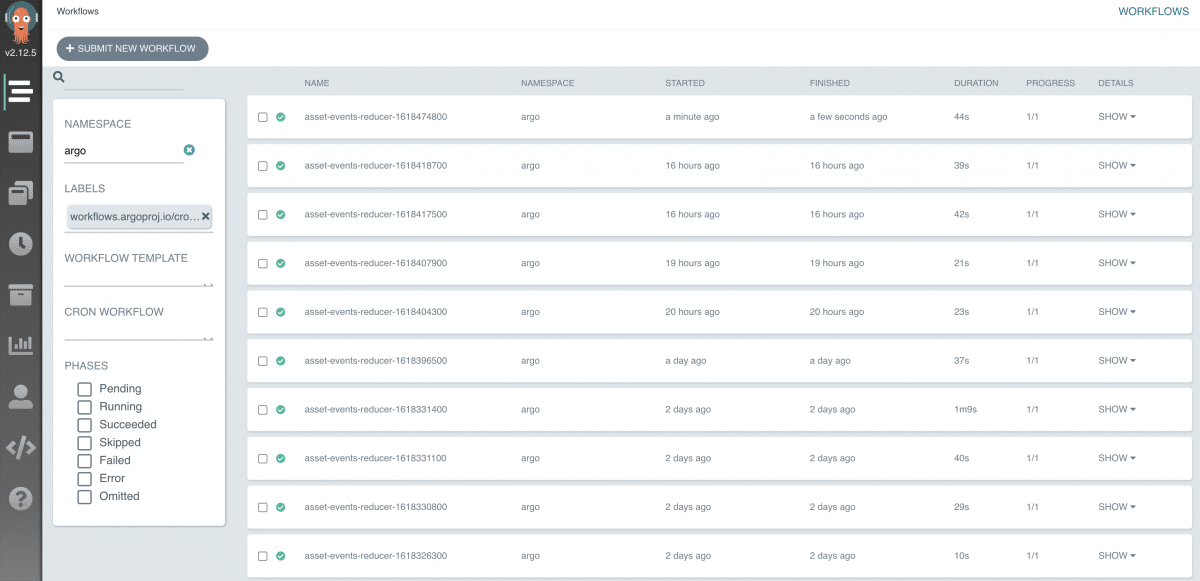
Although not being a specific tool for data pipelines, we chose Argo Workflows. The standout reason was the fact that all the ingestion code is written in Clojure. To use any of the other tools would require us to migrate the code to Python. Argo, on the other hand, is a Kubernetes container orchestrator, so it is agnostic to the code that is running, it just runs containers.
Argo has a visual UI that allows users to see which workflows are running and its past runs:
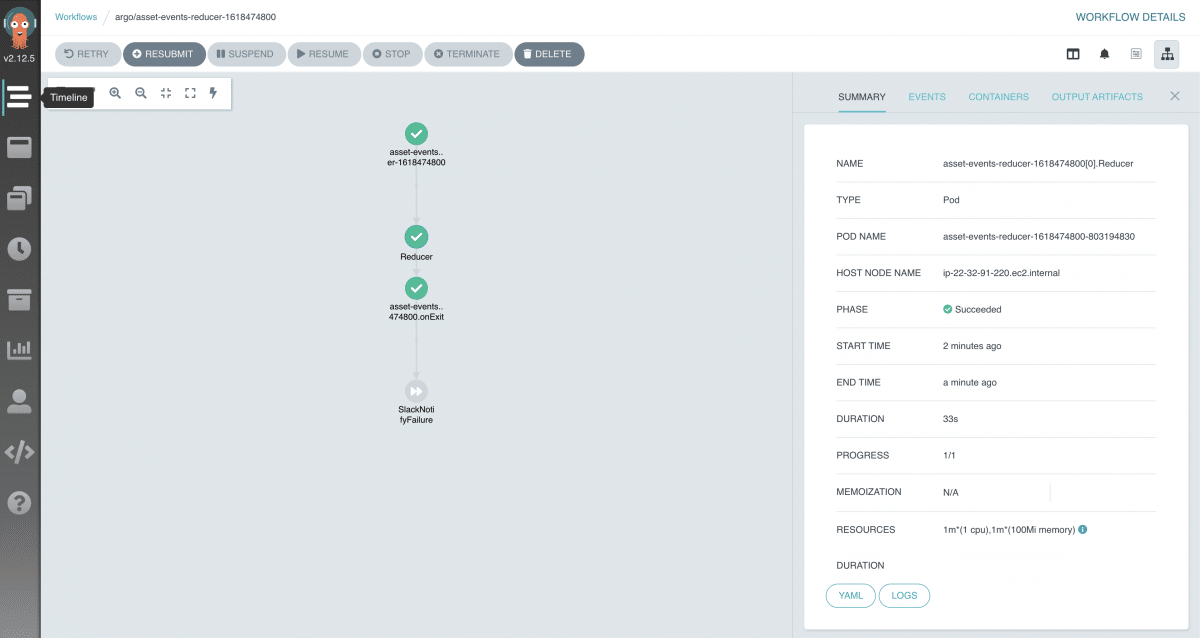
It also allows us to see the details of each run, including the container logs:
The flexibility to manage the data pipelines provided by Argo Workflows, has been much appreciated by our client, especially as we work within different time zones.
Using dbt to handle business logic within data transformations
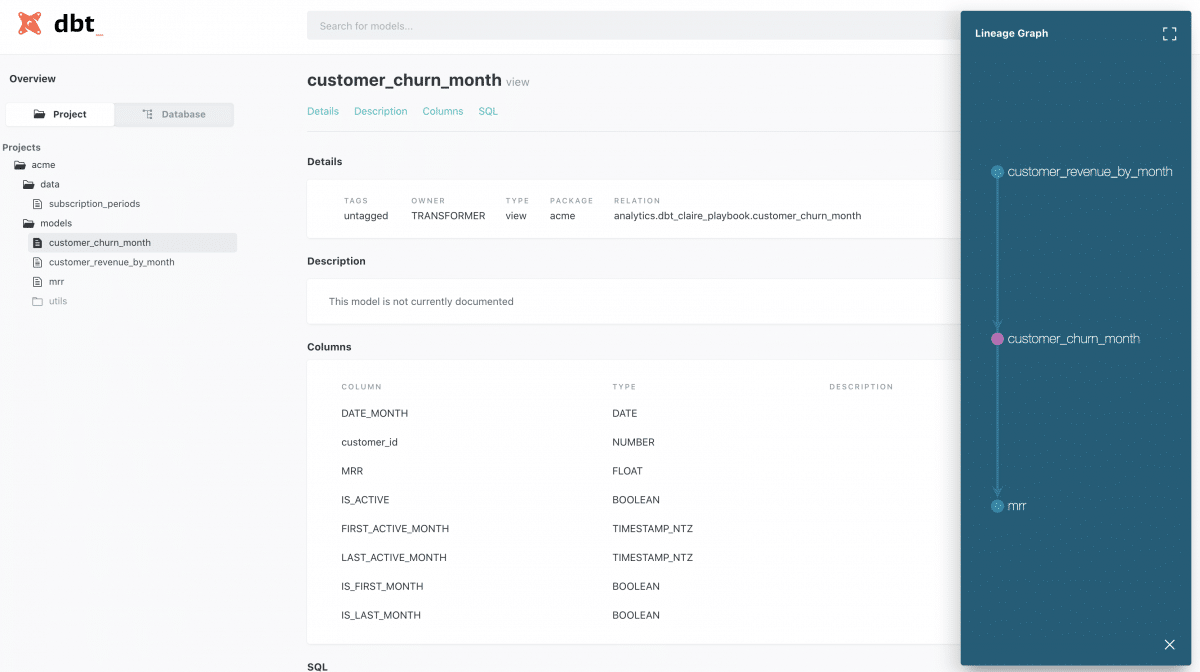
Also uncovered by the Data Health Check Revisit was the need for a better strategy for handling the business logic within analytics data transformations. To achieve this, we settled on a tool called dbt. Analytics engineering is the data transformation work that happens between loading data into your warehouse and analyzing it.dbtallows anyone comfortable with SQL to own that workflow.
The dbt model abstraction, allowed us to rewrite the business logic, currently spread over multiple places. The dbt tool also allowed us to add documentation for each model/field and to generate a documentation website with a pleasant UI which provides information about each table/field as well as the relations between the models (lineage graph).
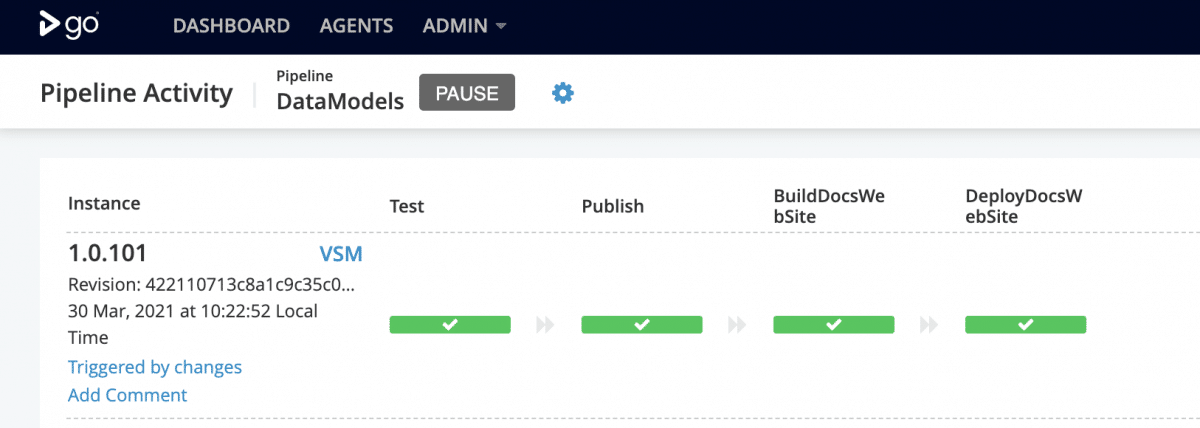
We further increased the value of this tool to the project by writing tests for the data models. Currently we deploy the data models using a deployment pipeline, as we use for the other software components, running the tests as a pipeline step.
The importance of a Data Studio Health Check for continuous improvement
Tools and tech apart, we feel it’s an important point that this approach of starting with a Data Studio Health Check, followed up with continuous improvement and a proactive mindset, has enabled us to evolve our client’s data strategy solution to provide much greater business benefit than ever before.
This new approach to do the ELT using Argo Workflows and dbt has allowed us to:
Centralize the analytics business logic
Enrich the data transformations with tests
Create documentation for data
Improve the data lag from 2h to 10 minutes
Next, we’ll be releasing a new blog post containing a github repository with an example of the referred data pipeline architecture.
Thank you Tiago Agostinho for pairing with me to write this article. If you feel that your organisation could benefit from a Data Health Check, or would like more details on how dbt or Argo Workflows work, please get in touch using the form below.
Get in touch
Solving a complex business problem? You need experts by your side.
All business models have their pros and cons. But, when you consider the type of problems we help our clients to solve at Equal Experts, it’s worth thinking about the level of experience and the best consultancy approach to solve them.
If you’d like to find out more about working with us – get in touch. We’d love to hear from you.