From Idea to Value – a simple way to solve a complex problem
Recently, I was asked to outline the Equal Experts’ solution to one of the most common problems in strategy: how to optimise the time between having an idea and realising value from that idea.
This blog post is a brief introduction to the process, with each point expanded on in this video.
The good news is that the answer is relatively simple (my talk lasts just over ten minutes) and comprises three steps:
First, you make sure your idea aligns with the strategic priorities of the business. That way you know you’re working towards an outcome that contributes to something meaningful and valuable.
Then you place “Bets” — acknowledging that your idea at this stage is still full of assumptions and unknowns that need to be proven out.
Finally, measure progress by regularly taking leading, attributable metrics and sharing them with others. That way, when making decisions, evidence is your guide.
Step One: Ensure your idea is aligned to the strategic priorities of the business
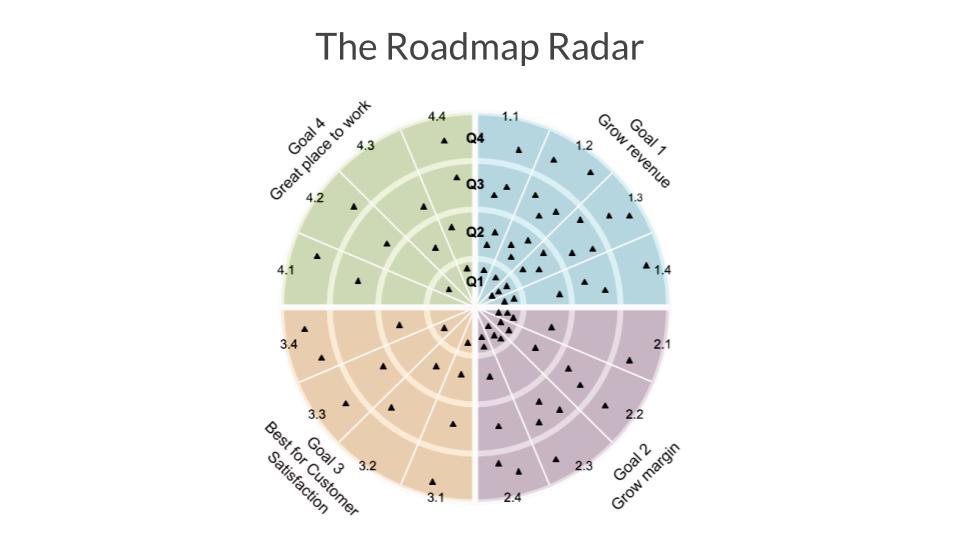
The best way to ensure alignment is to run an OKR session. Once the key goals and outcomes of the organisation have been gathered, plus the measures of progress, the portfolio can be visualised as a “Roadmap Radar” — an example of which is below.
The “Goals” gathered during the OKR session define the coloured sections of the Radar — typically, there are 4–5 of them. They are the long-lived North Star of the organisation, capturing its purpose and values. “Outcomes” are the strategic priorities that align to the overall Goals (the “pizza slices” of the Roadmap Radar), divided into quarterly time horizons. Lastly, there are the “Bets” — the olives on the pizza. Each one of the “blips”’ on the radar represents a time-bound experiment designed to explore the attributable impacts of an intervention.
Step Two: What do we mean when we say “Place Bets”’?
The word “bet” encourages decision-makers to confront how much they are willing to invest in the desired outcome, in terms of people, time, budget (that could be spent elsewhere). It relies on the design of a structured experiment that creates feedback loops, validates the value of an idea, proves out assumptions, and reports on progress towards specific, leading metrics.
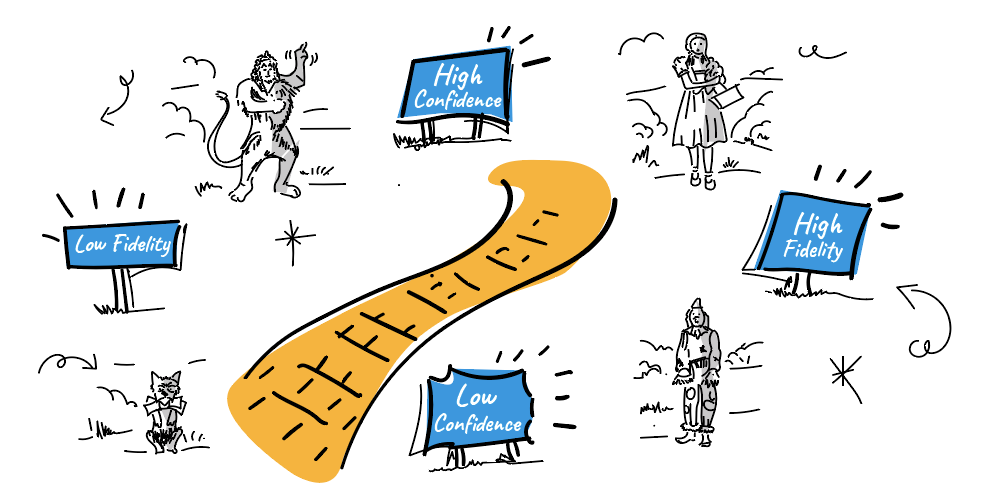
One question stakeholders regularly ask is: how do you decide on how “big”’ to go on a bet? I’ve found this a useful way to guide my thinking – it’s an adaptation of Constable’s Curve and describes the relationship between confidence and fidelity.
Recently, a client wanted to add a new product offering to their online store, but to actually create and sell it at-scale would have meant a huge upfront investment, and therefore risk. Instead, they gathered evidence of demand by offering the customer the ability to buy the item online, with those that clicked through receiving a regretful message saying the item in question was temporarily out of stock, and instead invited to consider some alternatives (which did exist in the real world). In this way, the client was able to use evidence to improve their confidence in the idea, without risking time or money on an idea whose value was essentially unknown.
The challenge is to design experiments that sit on exactly the right spot of the Yellow Brick Road between confidence and fidelity, thereby proving – or disproving – the key assumptions without a disproportionate exposure to risk.
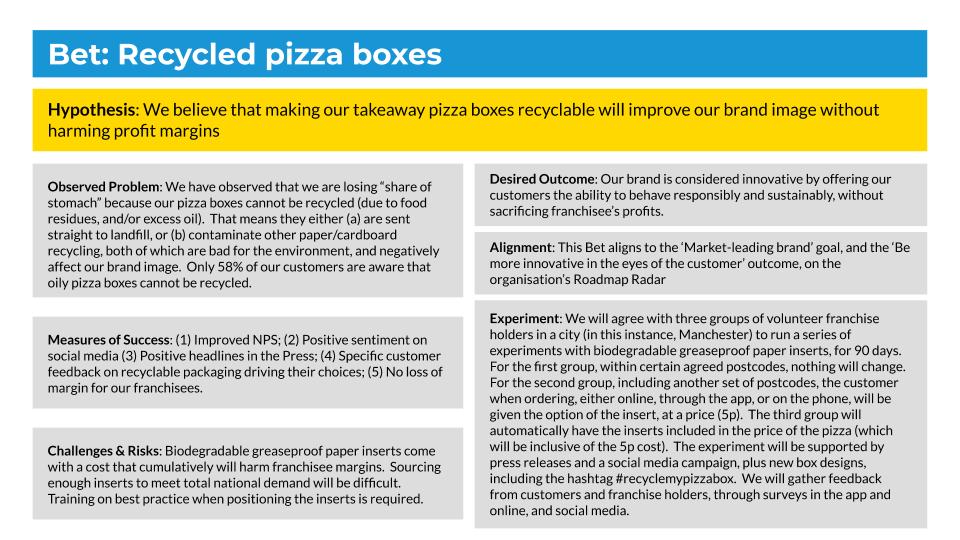
Step 3: Structuring thinking using the Bet Canvas
The best tool for the job of designing effective experiments is the Bet Canvas — illustrated below.
The Bet Canvas will typically become covered in next-best actions — but doing them all at once would make it impossible to reliably attribute cause and effect. Instead, you have to decide who will do what now, who will do what next, and who will do what later. Designating primary responsibility for each action allows everyone to know who to ask about what, at any time.
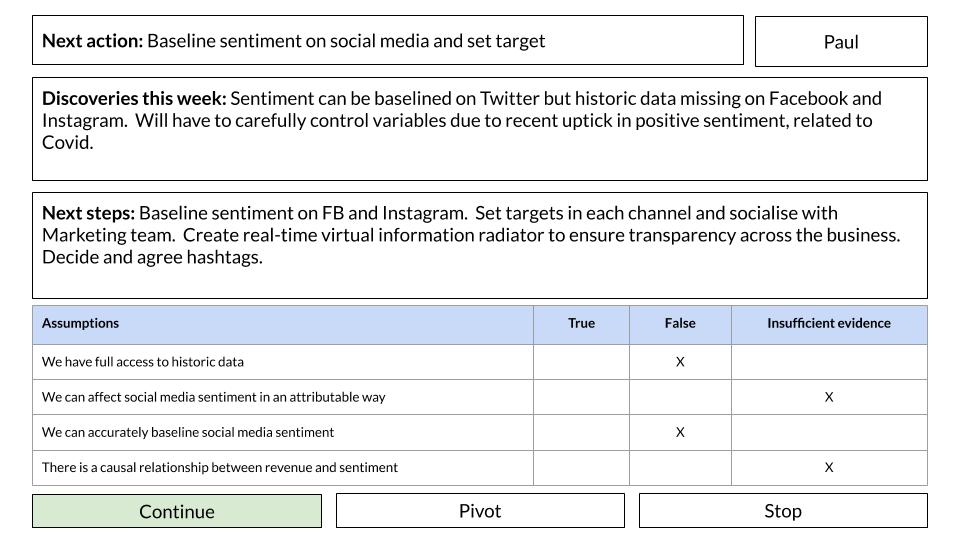
That requires a last tool: the Bet dashboard.
Each week, the person responsible for an action uses the dashboard to report back to their team (and colleagues in the winder business) on what they’ve discovered. Each new thing that you learn helps define the next step — and you’ll notice that the dashboard explicitly acknowledges the assumptions underpinning the experiment. The point here is to ensure your efforts are aimed at gathering enough evidence to reliably say which of your assumptions have been proven right or wrong. Once you’ve emptied out the “Insufficient Evidence” column, you can say with confidence whether you should continue, pivot or stop.
Good luck!
And there you have it — a simple process designed to help you proceed quickly and reliably from idea to value.
If you have any comments or questions about this process, we’d love to hear from you. The slides are available here, my email address is on the final slide of my talk, and/or you should visit our website. And best of luck!
Get in touch
Solving a complex business problem? You need experts by your side.
All business models have their pros and cons. But, when you consider the type of problems we help our clients to solve at Equal Experts, it’s worth thinking about the level of experience and the best consultancy approach to solve them.
If you’d like to find out more about working with us – get in touch. We’d love to hear from you.